f2022-public-labs
Lab 8.0: RISCV assembly lab setup
This tutorial will direct you to set up your first RISCV assembly lab and debug a simple assembly program on it via Visual Studio Code (VSCode).
This part of the lab is just setup - make sure to look at lab 8.1 for the rest of the lab!
Note: This lab, and all other labs going forward, should ideally be completed on your personal computer. Post on Piazza if you encounter issues while setting up on your own machine.
- Lab 8.0: RISCV assembly lab setup
1. Environment Setup
1.1 Setting up RISC-V tools on login
We’ll be doing these labs in VScode, but before we spin that up, we need to set up our ECN accounts so that they load the correct tools when you log in.
SSH to eceprog.ecn.purdue.edu, or any one of the lab machines (there are 34 you can use, and their addresses have the same format of ee69lnxYY.ecn.purdue.edu, where YY is 01-34.) When you can see the prompt, add the following to the bottom of both your ~/.bashrc and ~/.profile files (create the latter if it doesn’t exist):
case $(hostname) in ee69lnx* | eceprog* )
  module load riscv
esac
If you don’t have a .bashrc file in your home directory (~), you can copy the template one as follows:
cp -n /etc/skel/.bashrc ~/.bashrc
where -n ensures you don’t accidentally overwrite an existing .bashrc. If it already exists, edit it.
This case structure checks if you’re on any of the eceprog cluster nodes or any of the lab machines in EE 69, and then loads the RISC-V module, configured for us by ECN. This ensures we don’t accidentally conflict with RISC-V tools that may be installed on other servers. Once you’ve added it, close the session and log in again. You should see a bit of a delay as the tools load, and then type which riscv64-unknown-elf-gcc. If it says “/package/riscv-gnu-toolchain/bin/riscv64-unknown-elf-gcc”, that means your shell is now able to find the compiler for this lab, and VScode will find it as well when it logs in remotely.
If you get an error that says “module: command not found” on an ECN machine, ensure that you are on an eceprog cluster node or EE 69 machines first! If you are, you may need to add the following before the case structure above:
module () {
	eval $($LMOD_CMD bash "$@")
	[ $? = 0 ] && eval $(${LMOD_SETTARG_CMD:-:} -s sh)
}
1.2 Visual Studio Code
To make the environment consistent for everybody, the recommended editor for the assembly lab will be Visual Studio Code (VSCode), but we’ll be running a remote version of it on ECN servers (you may have done this already for previous classes) so that you can work on it from home with the same tools as the lab machines. On your own machine, download and install it from here.
Note: You can also opt out of VSCode and use your own editor, provided you are familiar with
gdbandmake. This lab is entirely doable on the command line as well. You will need to manually create a debug session to the RISC-V QEMU emulator and attachgdbto it. You can checkout the Makefile deep dive section further down for more info.
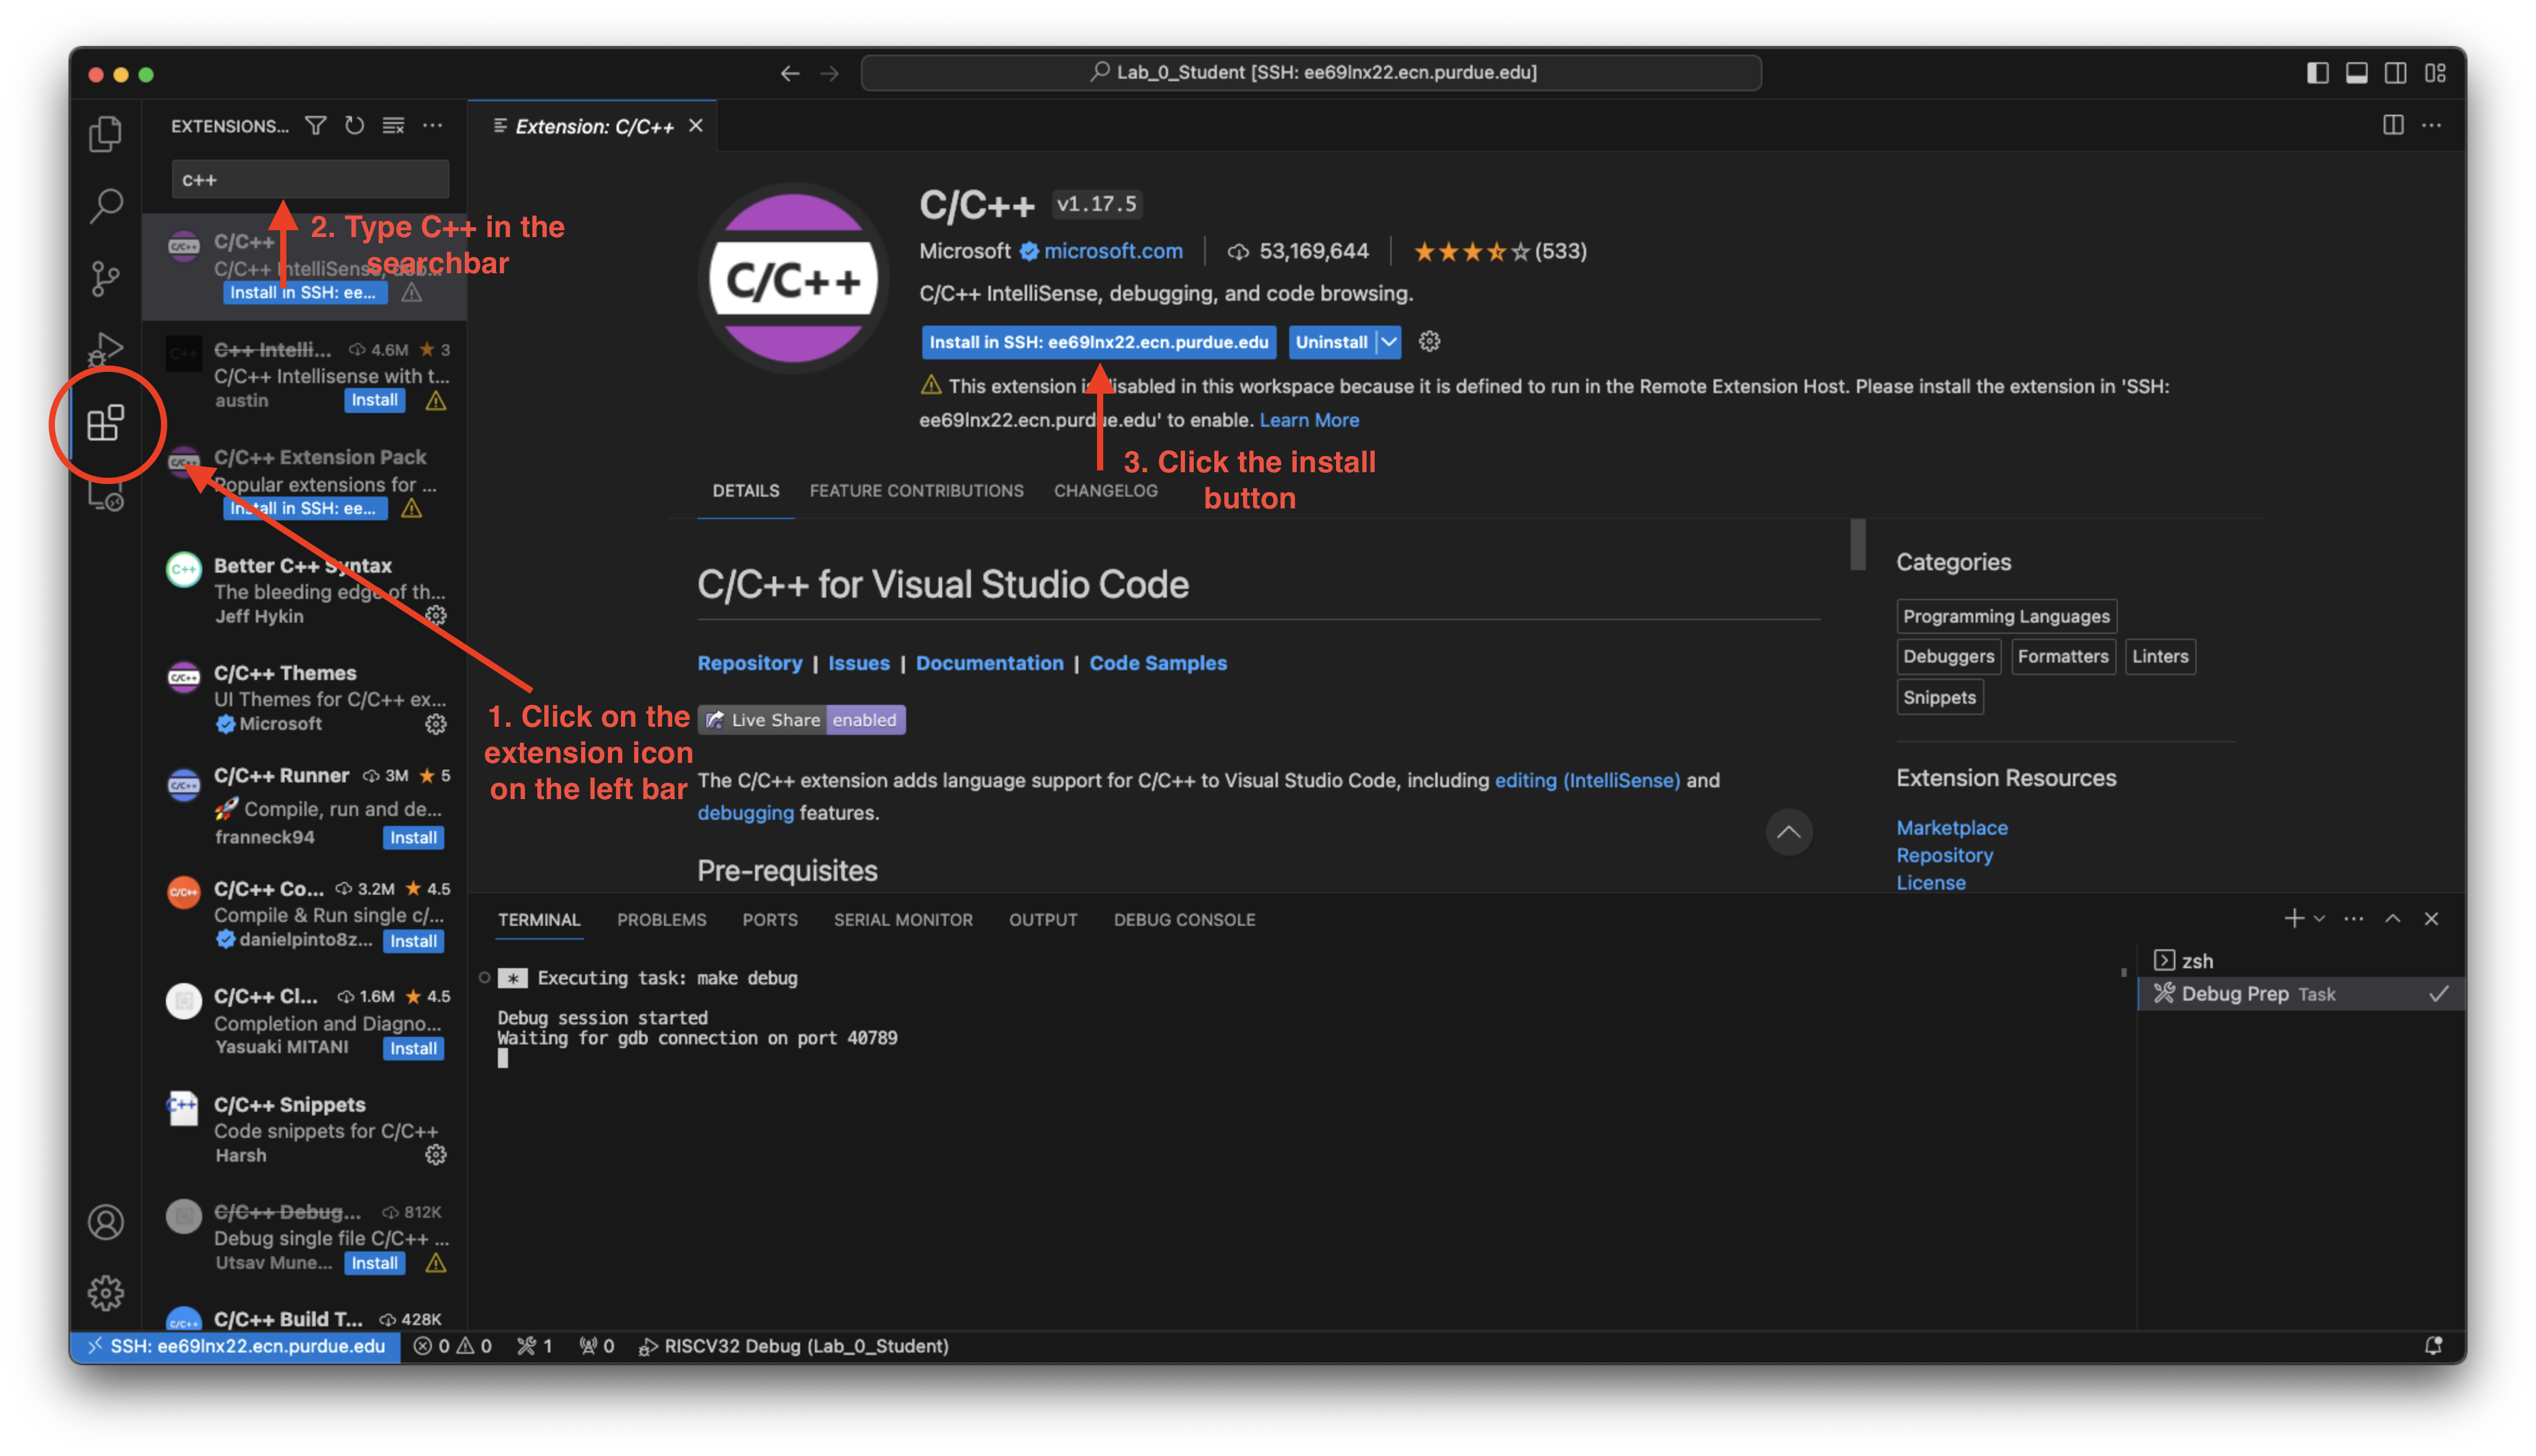
1.2.1 VSCode extensions
In order for the debugging part to function properly, we will need two extensions installed:
To install them, you could either click on the links above and follow the install steps, or you could search them on extension tab on VSCode:
For the last extension, we will be installing a modified version of Native Debug, which gives us ability to set breakpoints in assembly file. The installation process will be a bit different:
- First download the
riscv-debug.vsixfile here to your lab machine.- If you are working with remote vscode access, you will need to copy the
.vsixfile to the server. Checkoutscpfor more details, or download it using the terminal - copy the URL for the vsix file, and typewget URLin the terminal to download it to your ECN account.
- If you are working with remote vscode access, you will need to copy the
- Then click on the extension tab and press the
...button on the top right of extension window. - Select
Install from VSIX...and locate your downloadedriscv-debug.vsixpath to install it: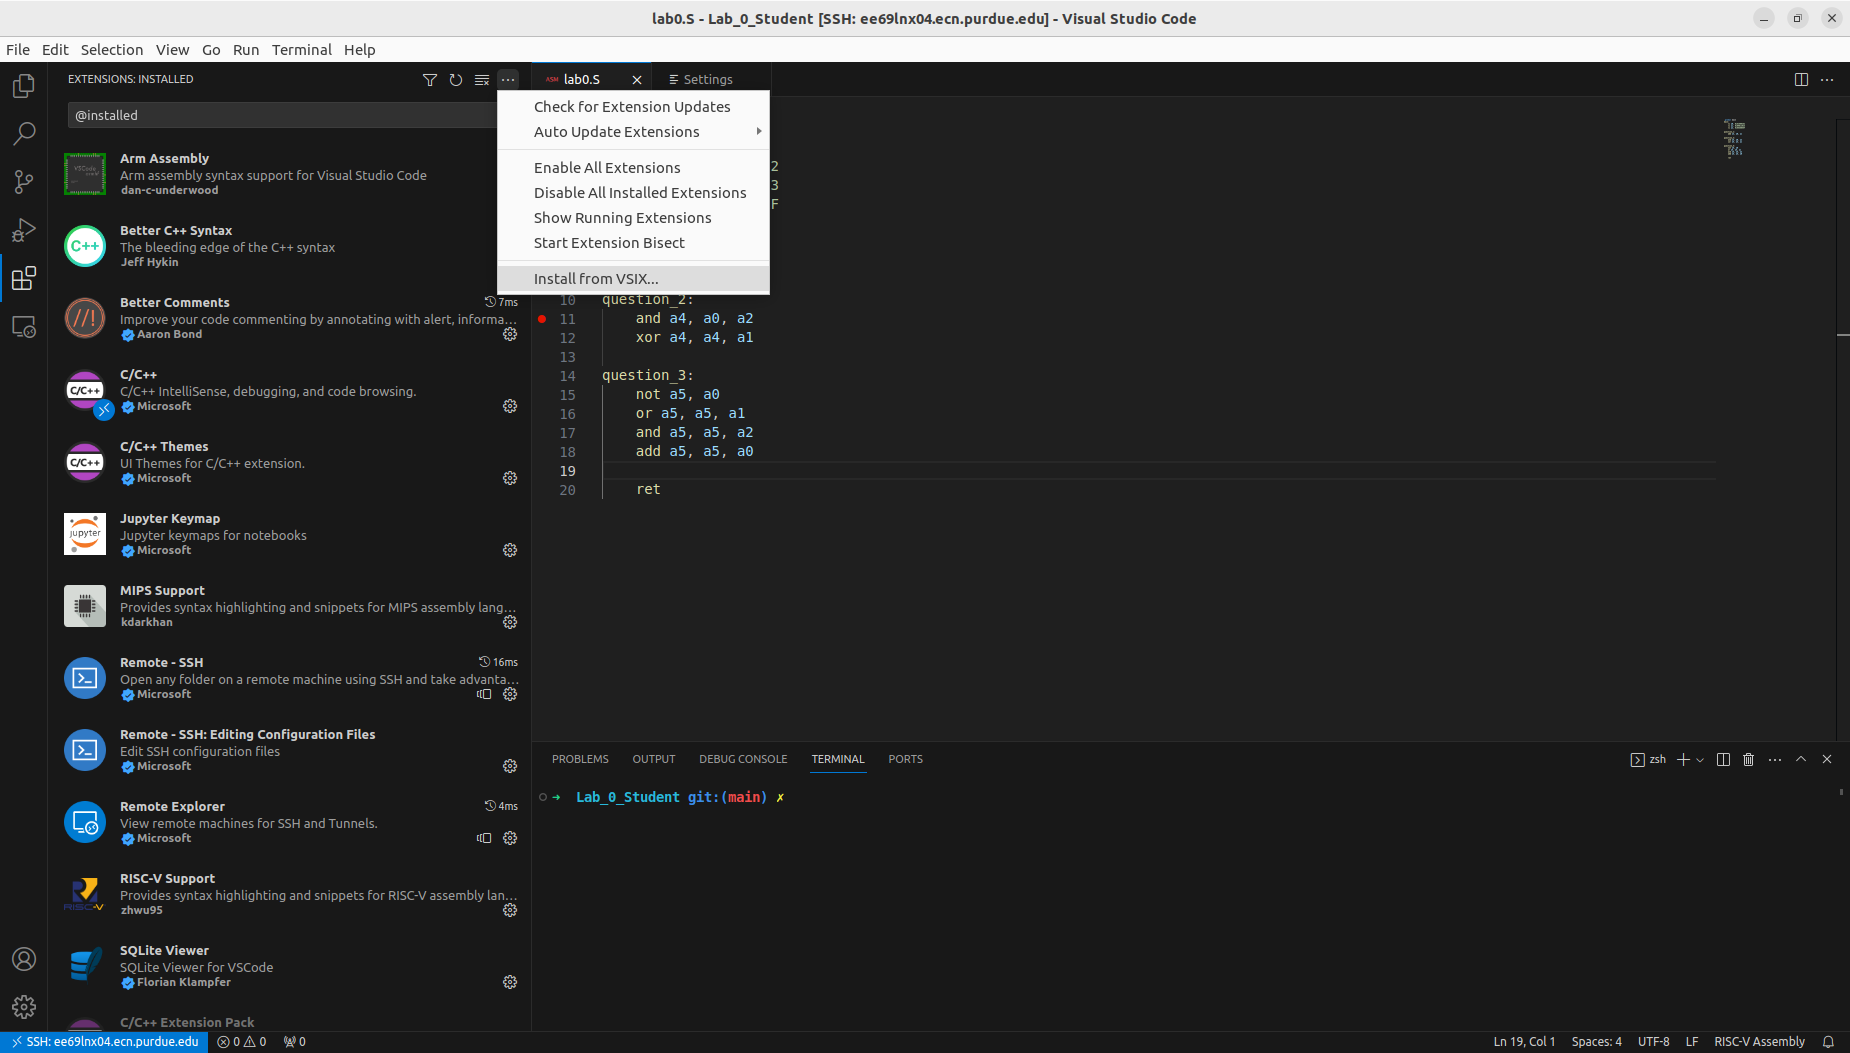
- You might need to reload VSCode to let the installation completed as prompted on the bottom right. Or you could do
Ctrl + Shift + Pand typereloadto reload VSCode window.
1.2.2 Remote access to the lab machines
Besides using VSCode in the lab, you could also remotely access the lab machine you normally sit at, in order to finish your assembly assignments.
Note: This section is meant to be run on your own PC, or other machine that is not a lab machine.
If you’re not on campus, you can alternatively connect to eceprog.ecn.purdue.edu, instead of the lab machines.
After downloading and installing VSCode, open it and locate the remote connection button on the bottom left of VSCode:
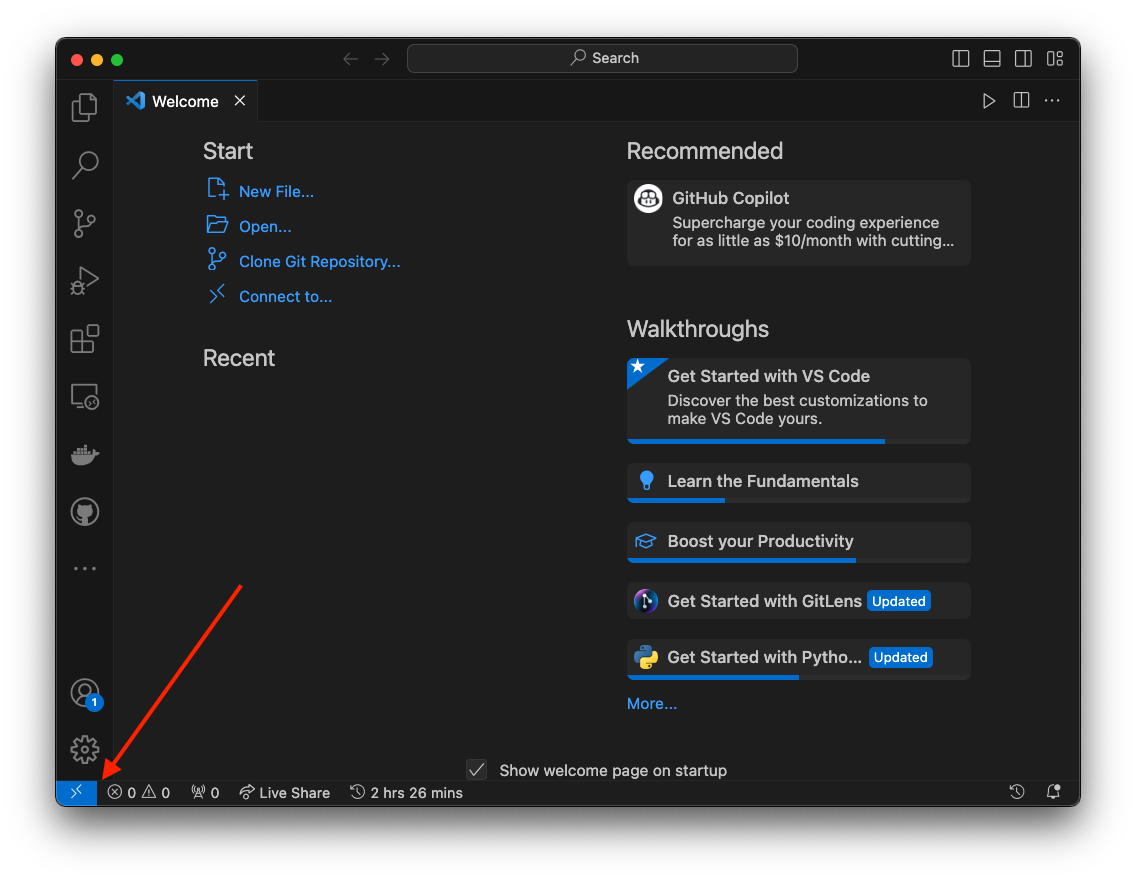
Note: If you could not find this button, you will need to download the
Remote - SSHmanually here or by searching it in the extension tab.
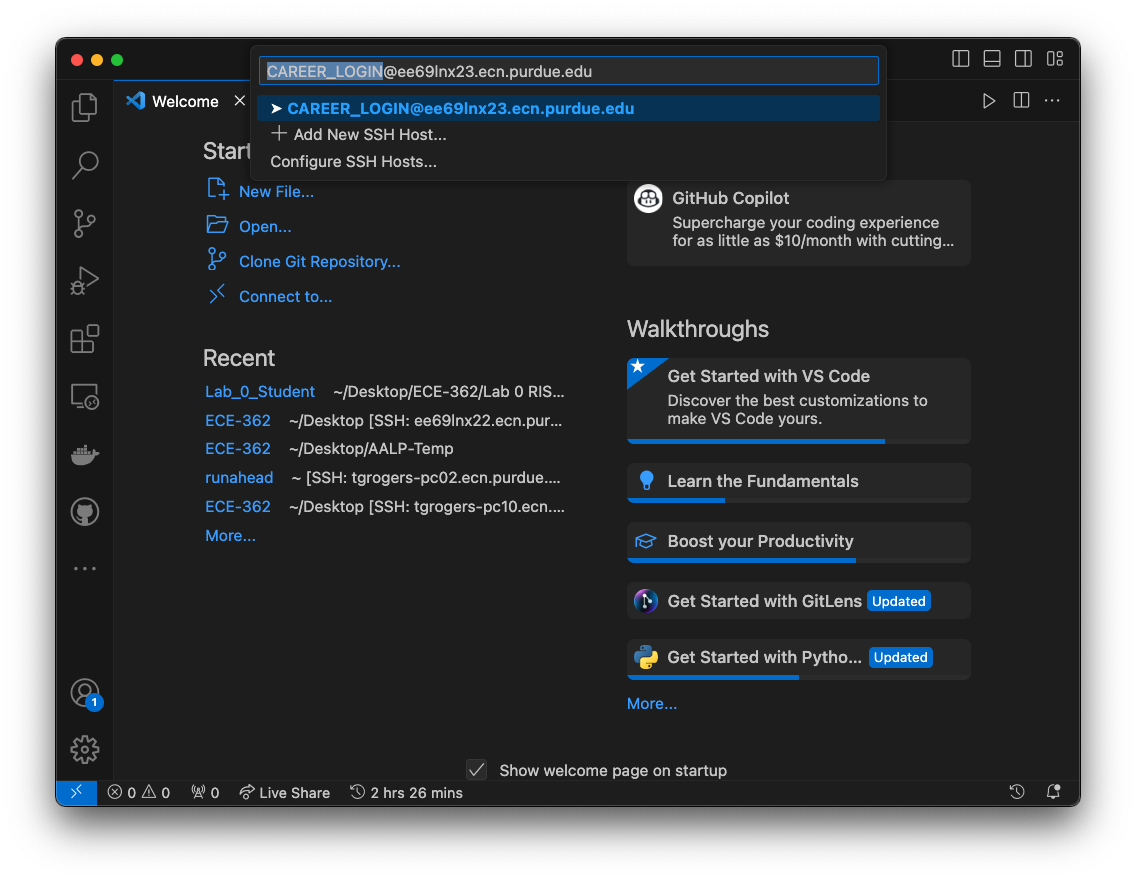
Click on the button and select Connect to Host... on the drop-down menu:
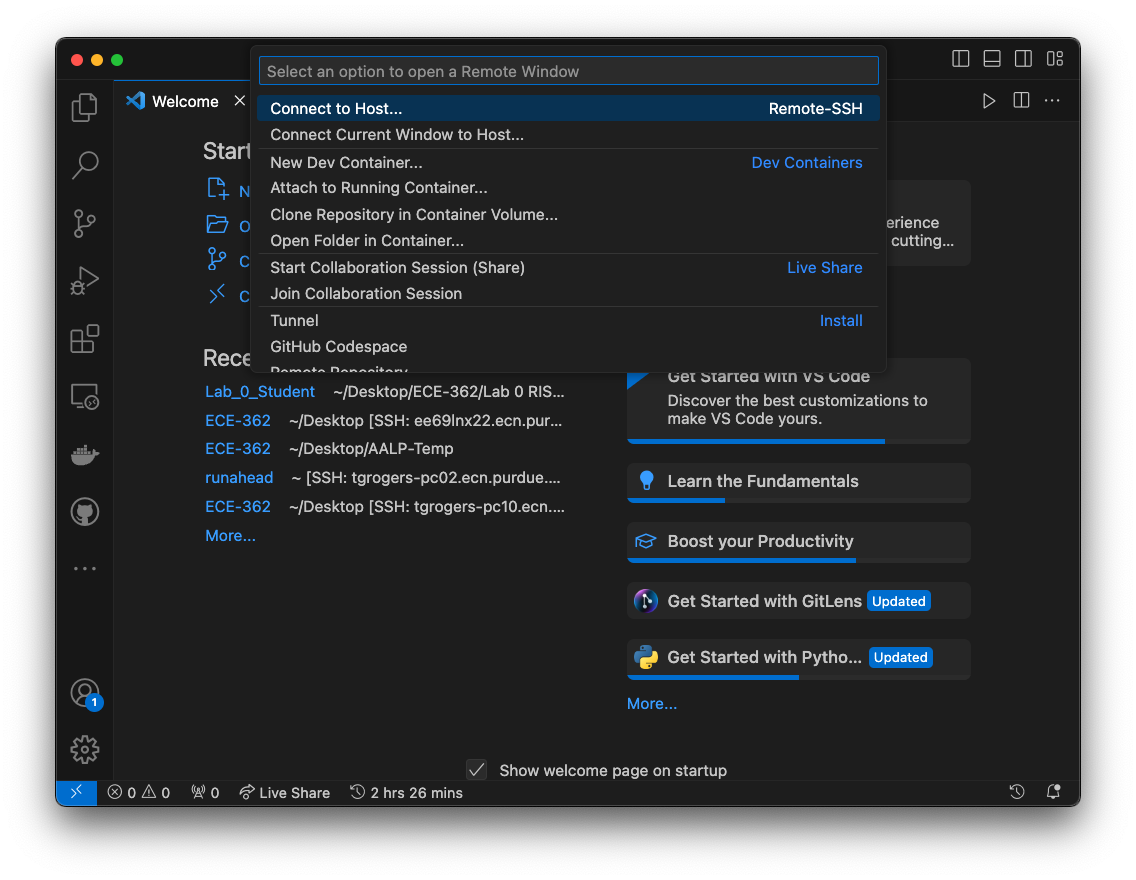
Then in the drop-down, enter CAREER_LOGIN@LAB_MACHINE_HOSTNAME and click on it. The CAREER_LOGIN is your career account login, and you can find LAB_MACHINE_HOSTNAME on your lab machine mainframe case’s label, which is something like ee69lnx23.ecn.purdue.edu. If you’re off-campus, you may also use eceprog.ecn.purdue.edu. (All ECN machines load the same data.)
This should open up a new VSCode window. If you encounter something like "ee69lnx23.ecn.purdue.edu" has fingerprint "SHA256:xxxxxxxxx", choose continue. You’ll see this message when you’re connecting to a server for the first time, to have you confirm you know what server you’re connecting to. This isn’t usually an issue when you’re connecting to Purdue machines on campus, but it is a concern if you see this message if you’re reconnecting to the machine.
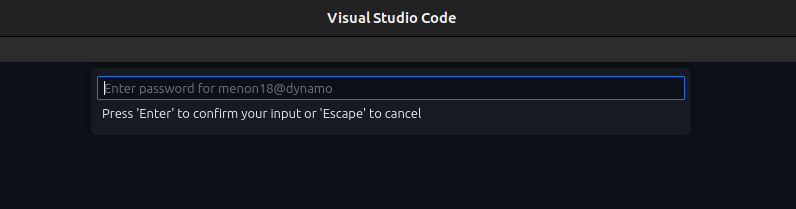
You may see a prompt for a password, if you haven’t already set up SSH keys (which we’ll explain further down.) Enter your Purdue Login password, with the “,push” as necessary, hit Enter, and approve it from your 2FA device. Once you set up SSH keys, you’ll be able to skip this step.
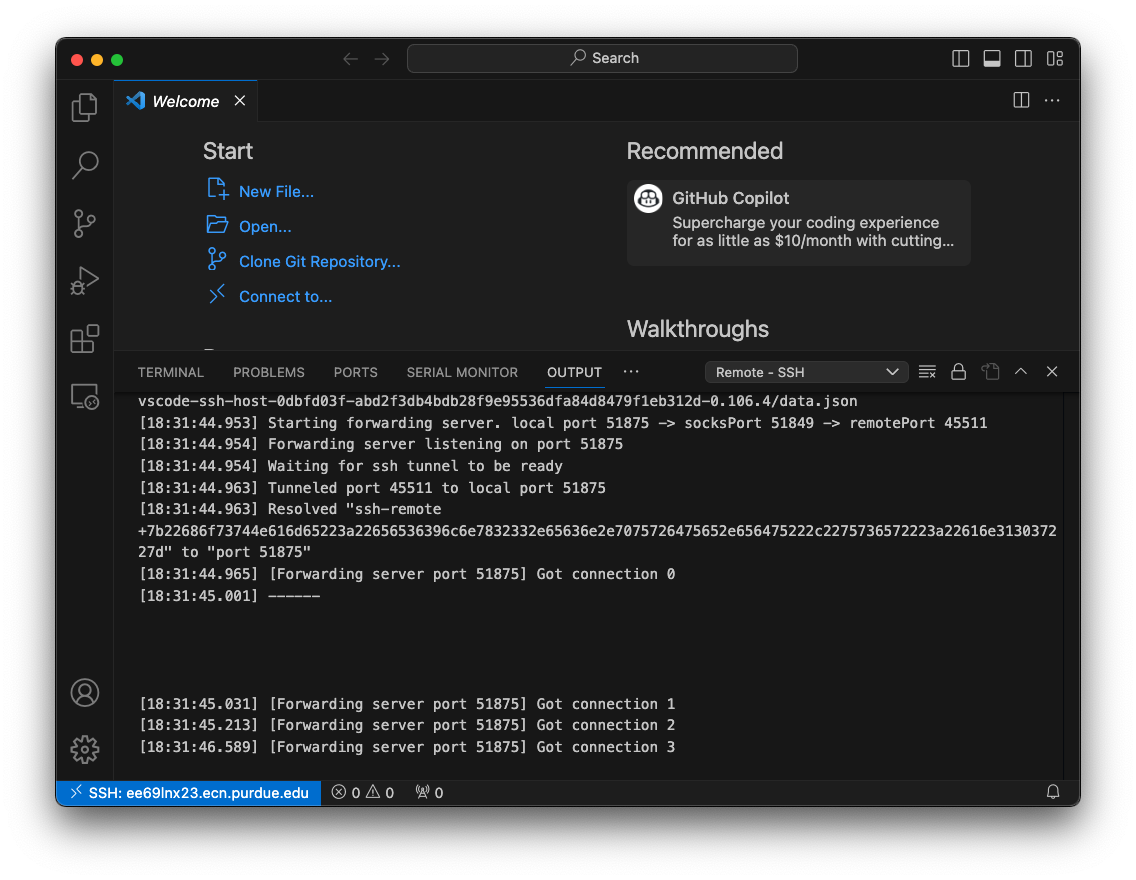
You should then have a window opened similar to this:
You could then open up your lab project, or use TERMINAL tab open a terminal and clone it via Git from the course website.
You might need to install some extensions again with remote ssh VSCode to debug lab (section 1.2.1). Check your installed extensions to find the missing one (if you have finished setup on a lab machine, this should just be the RISC-V Assembly extension as it is the only one installed locally).
A reminder: Once you’ve finished setup on one machine, you don’t need to redo the setup process on a different lab machine, since all ECN machines load the same data when you log in. Whether you log in to eceprog or a different-numbered lab machine, they will all have the same setup you were using.
1.2.3 Adding an SSH key to your ECN account
Note: This section is not required, but still highly recommended. Setting this up will save you from having to deal with two-factor authentication by using SSH keys instead.
Note: The key can also be added to GitHub so that you won’t need to use password every time for push/pull. Here is a guide on how to do this.
1.2.3.1 Linux & MacOS
If you don’t have an ssh key on your machine, you can generate it with ssh-keygen:
ssh-keygen -t ed25519 -C "your_email@example.com"
This will prompt you for passphrase and key location. You can keep those configuration at default.
After you have your key ready, we can upload to lab machine by doing:
ssh-copy-id CAREER_LOGIN@LAB_MACHINE_HOSTNAME
Where CAREER_LOGIN and LAB_MACHINE_HOSTNAME are the same when you setup VSCode remote ssh.
You will then be prompted with password and two-factor auth from duo. After this is done, you can access lab machine with the key only:
ssh CAREER_LOGIN@LAB_MACHINE_HOSTNAME
A more detailed guide is here from GitHub.
1.2.3.2 Windows
For Windows machines, here is a detailed guide from ITaP.
1.3 Setting up your first lab workspace
Using your terminal, do the following:
- Create a folder called
ece362under your home directory (where you should start by default) andcdinside it. - Download and extract the lab 8 template from the course website onto your lab computer using
wget, or clone lab 8 via the git URL posted on the lab experiments page.
Once it’s cloned, you’ll need to reopen the folder in VScode so that all the automation we’ve set up for you can be properly registered by VScode. Click File > Open Folder, navigate to the folder you just cloned, and open it.
This is a good test of your SSH key addition, because the VScode window will refresh. If it was properly added, VScode should not ask you for your password. If it does, double-check that copy-pasted your SSH public key into ~/.ssh/authorized_keys correctly. Ask on Piazza if this doesn’t seem to working, and upload the contents of your authorized_keys file.
You should now see your lab 8 folder open in the left sidebar, and various files - some you will edit, others will help you edit.
In this folder, open up the lab8.S file and examine its content. Then, use the instructions in section 2 to run the sample program. Make sure to set a breakpoint after the main: and verify that the registers have the corresponding values loaded in as you step each instruction.
2. A sample debug process
This section will walk you through the process of debugging lab code on VSCode.
2.1 Running the lab
At the beginning of every session, when your terminal has just started, make sure to run module load riscv. It may take a few seconds to load, but when it does, you should now have the RISC-V compiler in your PATH (a set of locations that your shell will look in to find programs.)
If you don’t mind waiting a few seconds whenever you open a new terminal, you can also add it permanently to your .bashrc. (Keep this in mind if you ever need to have a RISC-V compiler again in the rest of your student career - you will be able to use these even long after ECE 36200.)
To run the lab, in the VSCode integrated terminal (access via the TERMINAL tab), type make:
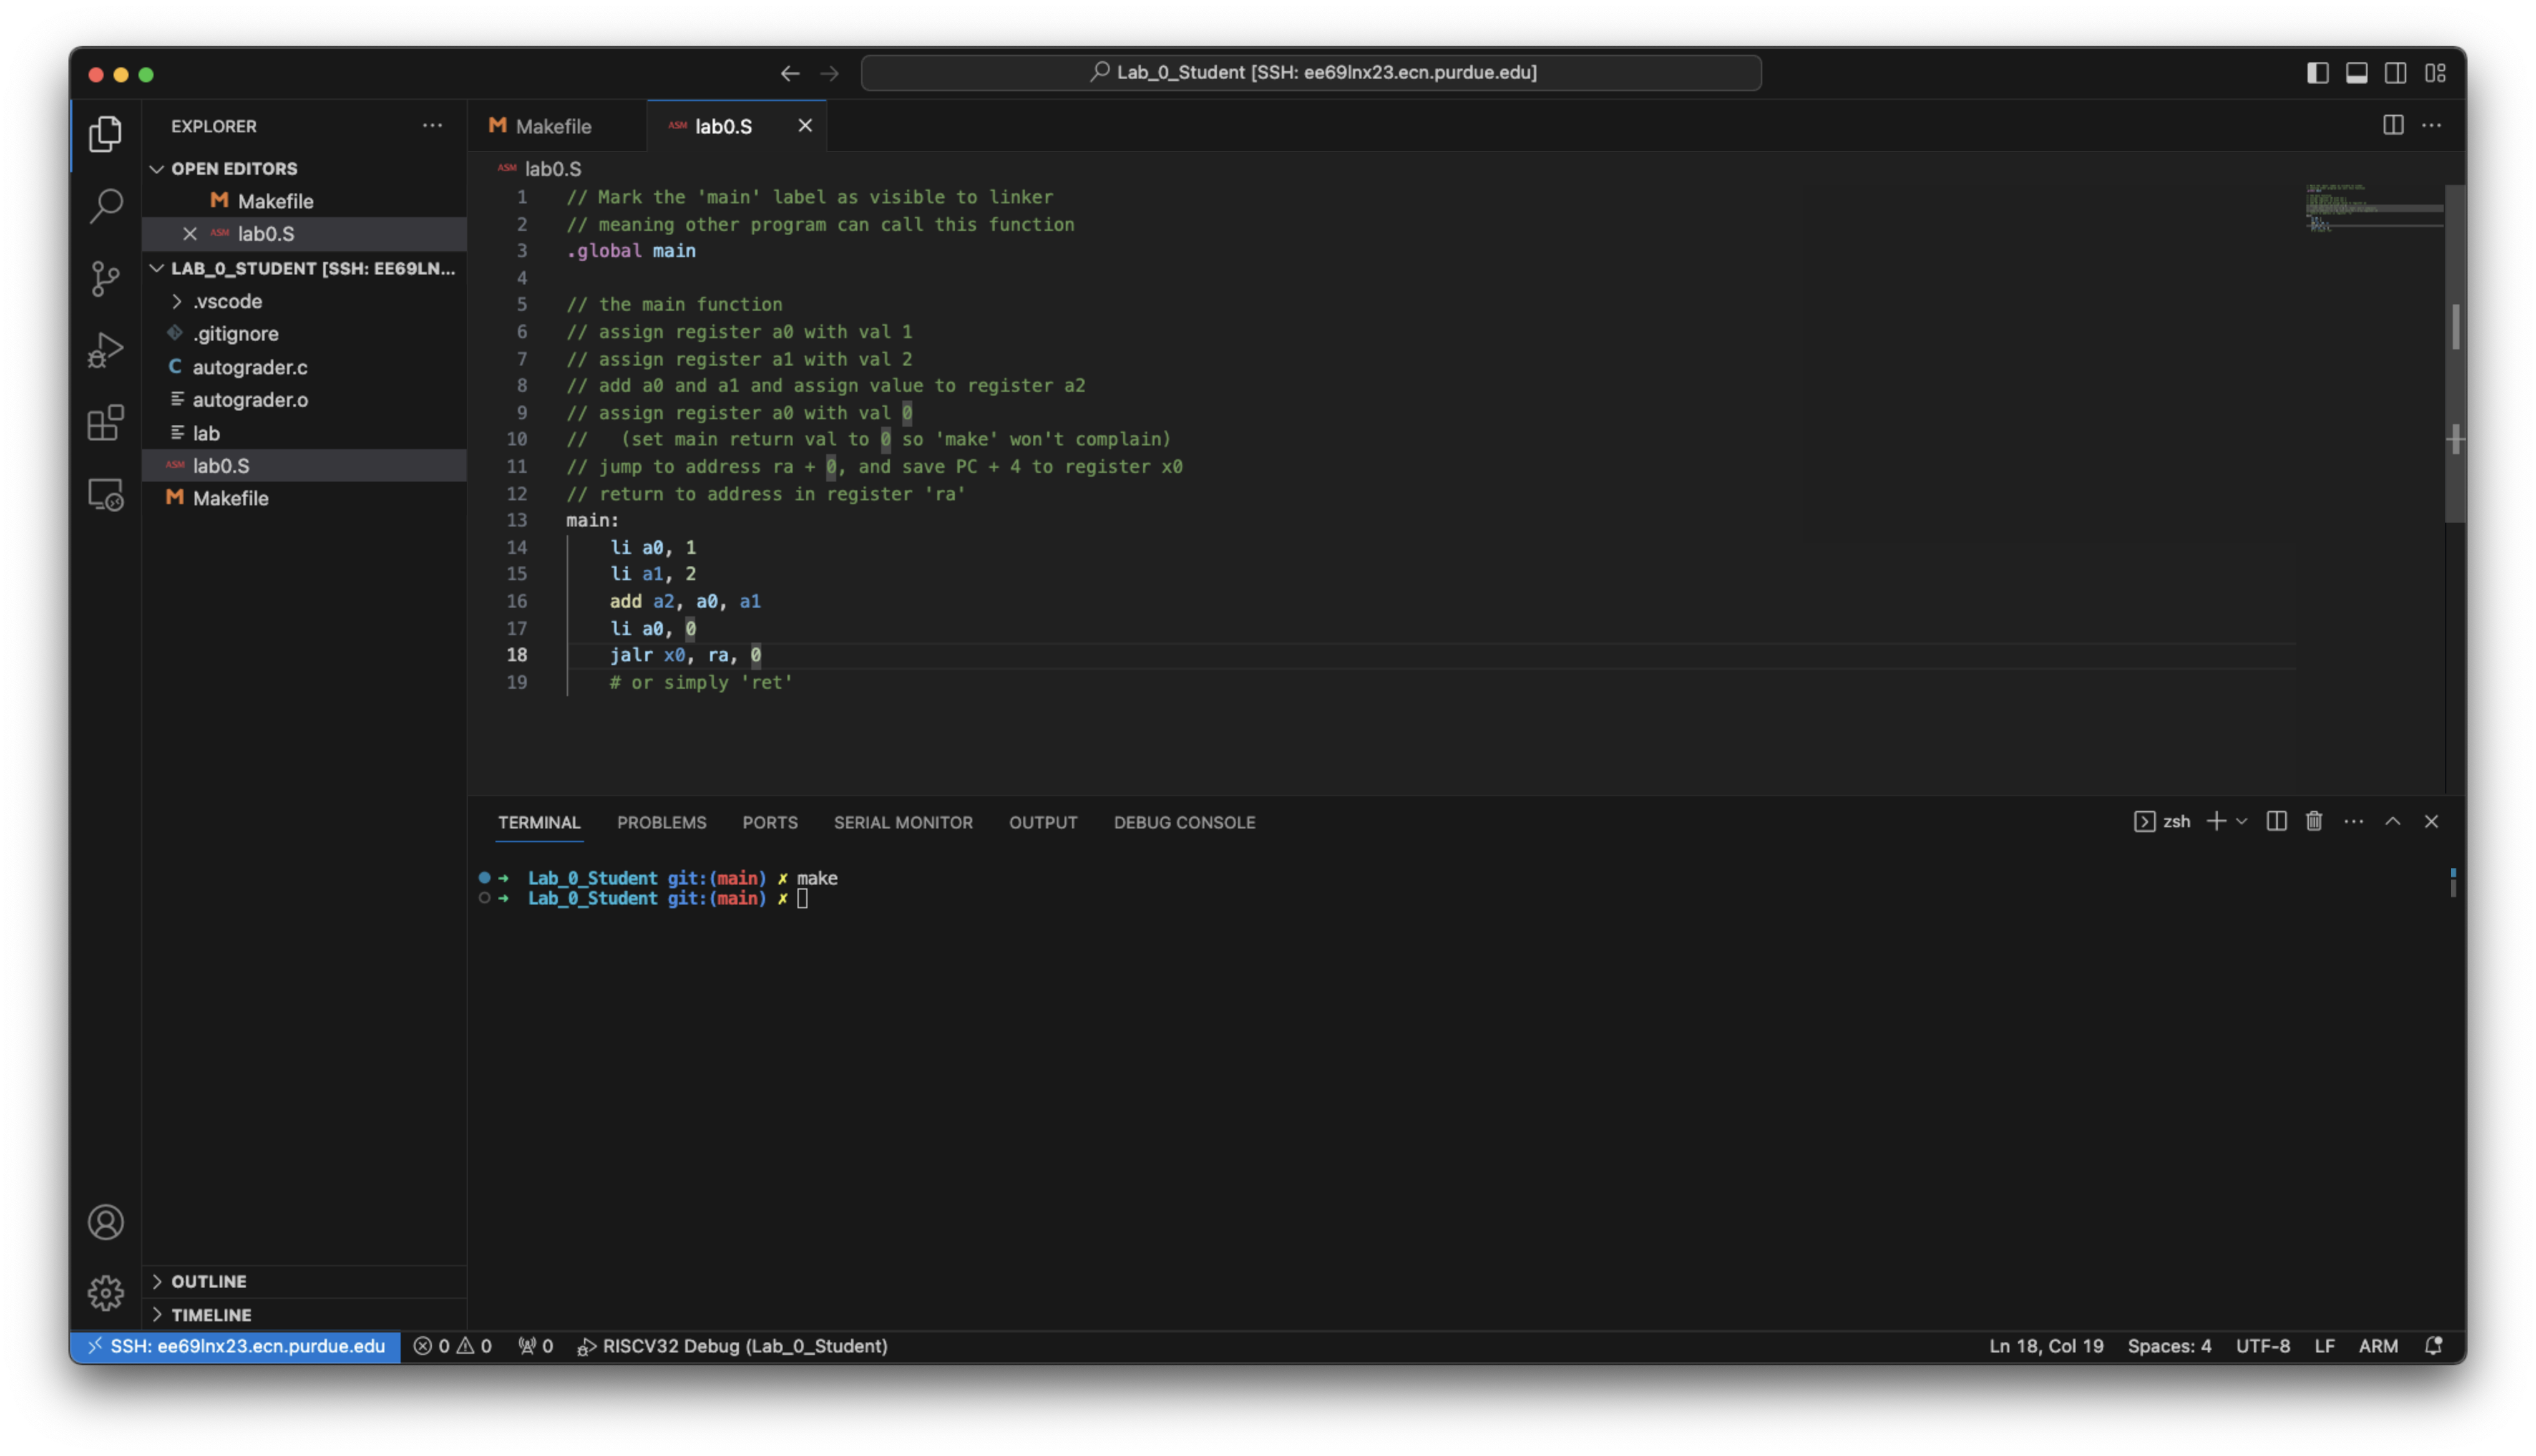
Hmm… nothing happened… or did it? Two files will appear on the left: lab and autograder.o, meaning we did compile the lab successfully. However the main function did not print anything to the console as it is somewhat equivalent to:
int main() {
    int x = 1;
    int y = 2;
    int z = x + y;
    x = 0;
    return x;
}
Note: You can also use
make runto compile and run the lab.make labwill just compile. Checkout theMakefileor usemake helpto find out more.
2.2 Begin debugging
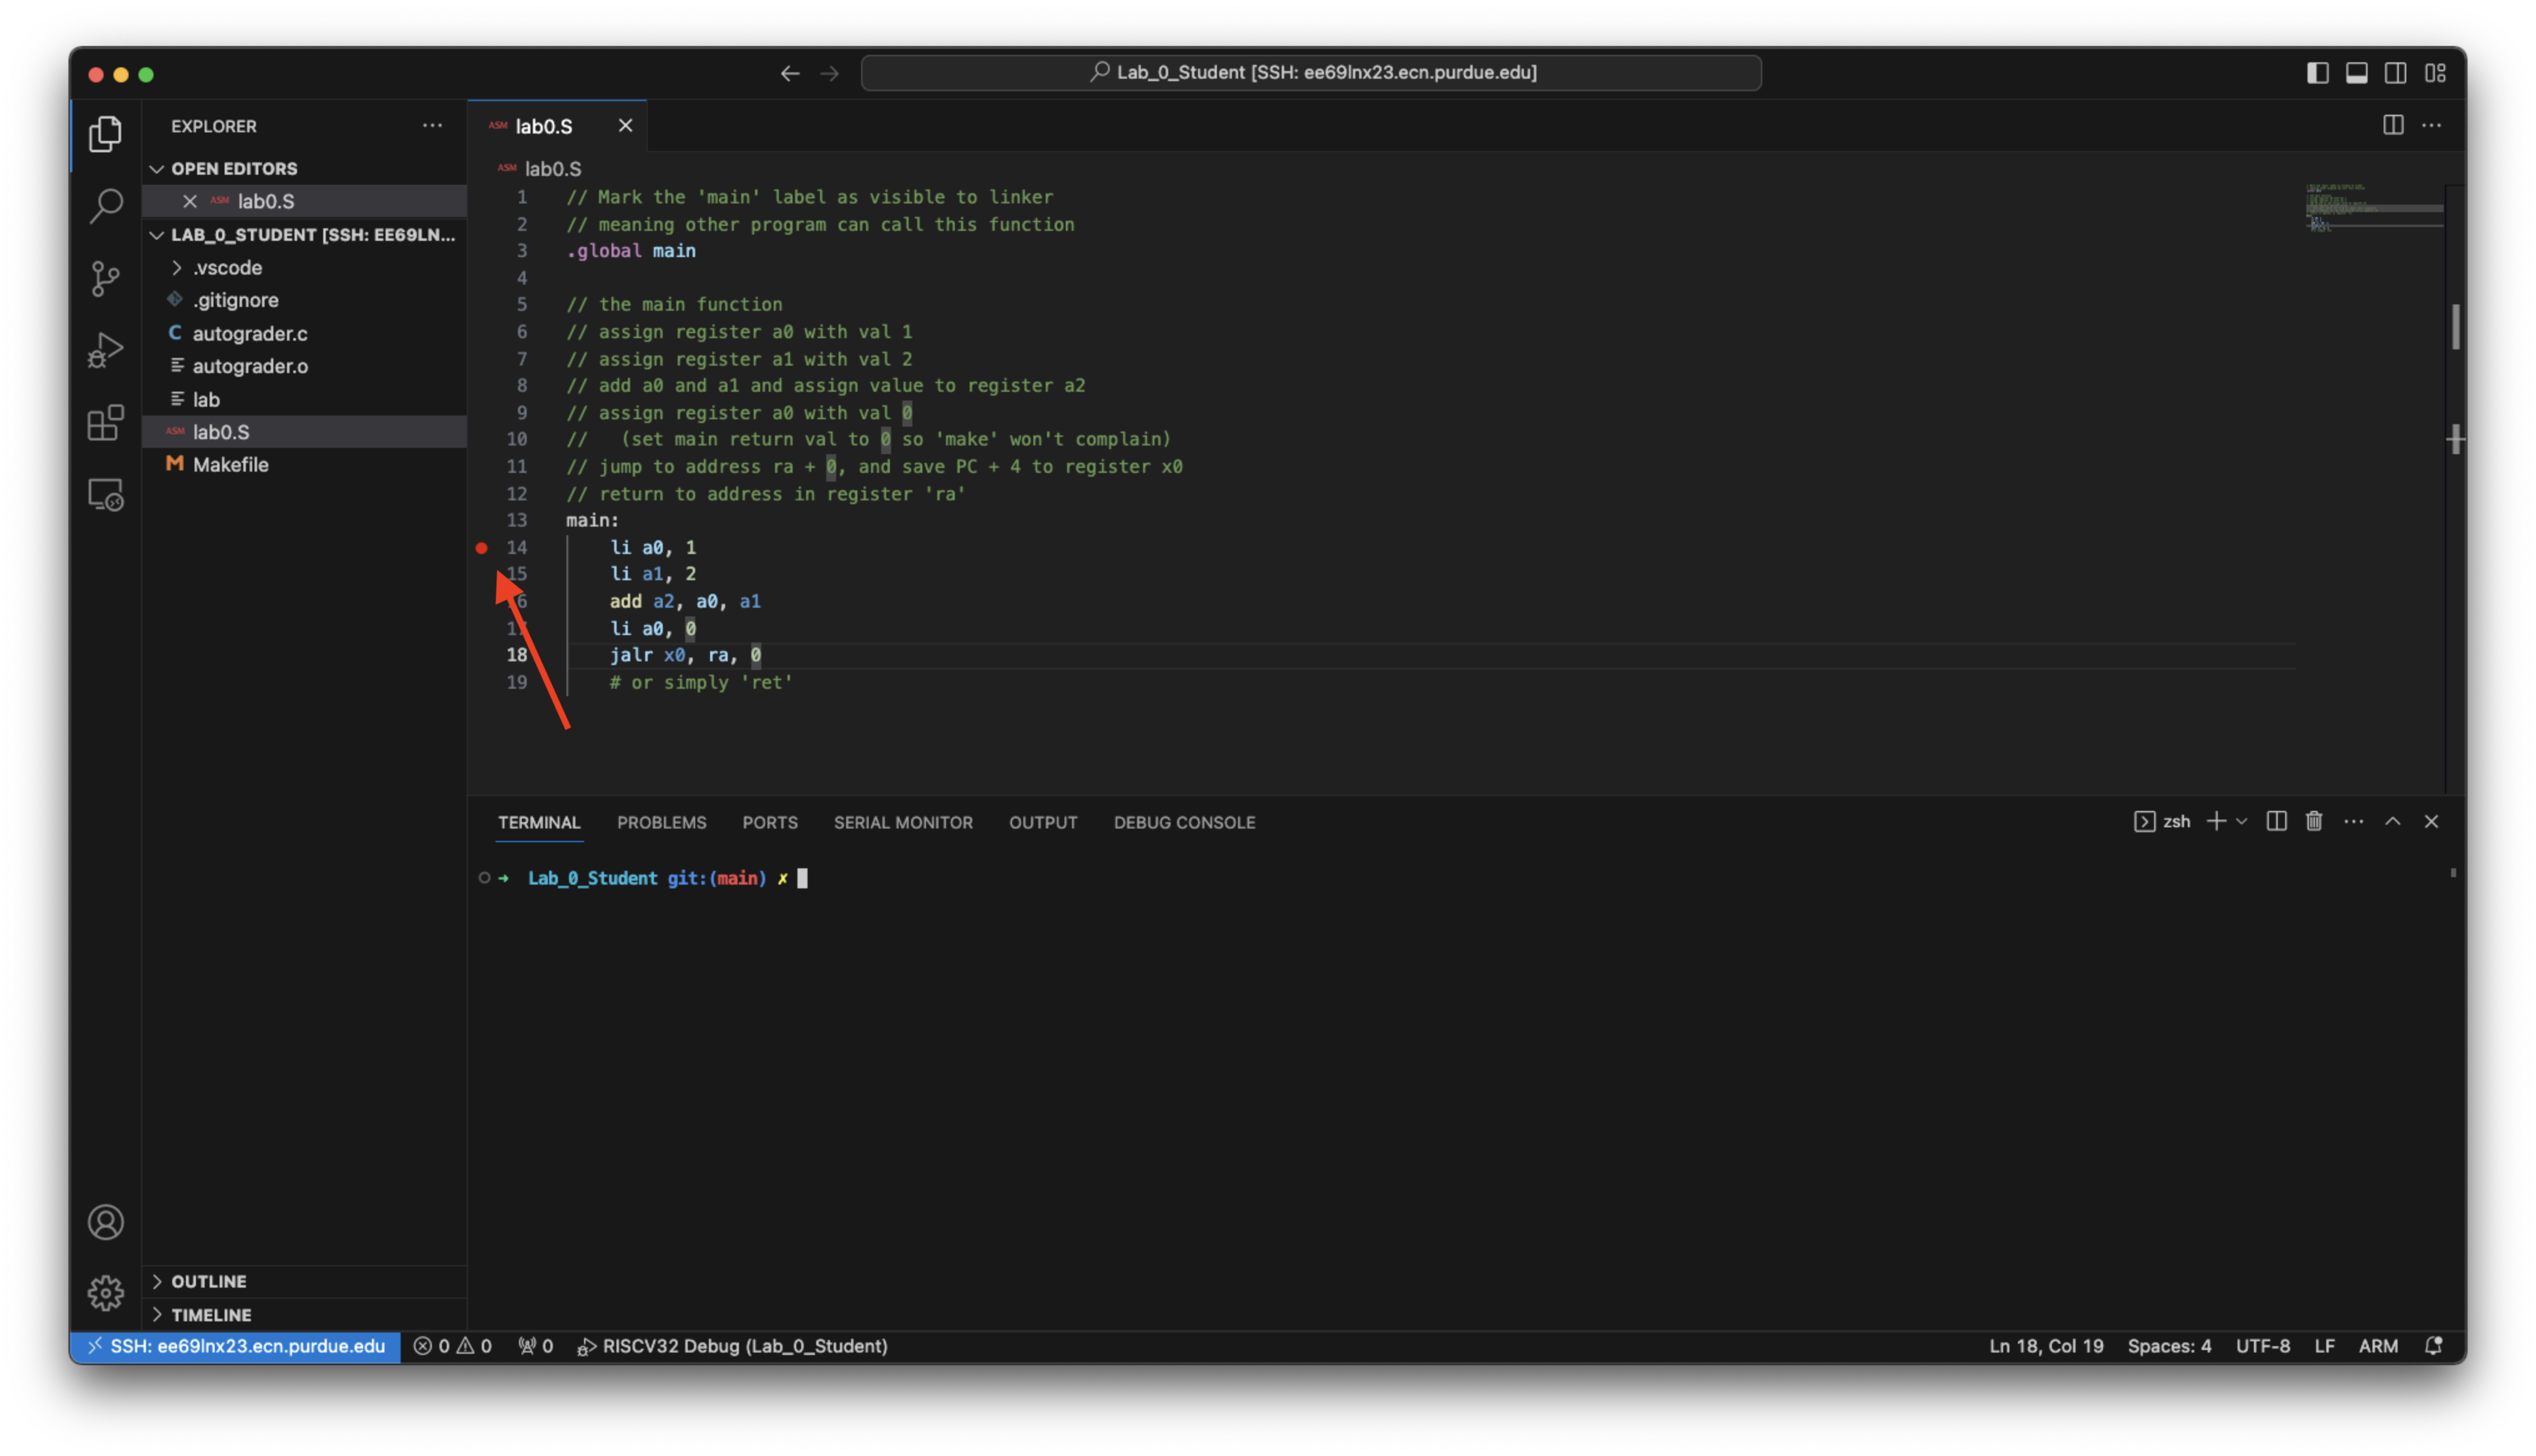
Before debugging, you will need to set breakpoints in the assembly file (the file with a .s extension) by clicking on the right of the line number like this:
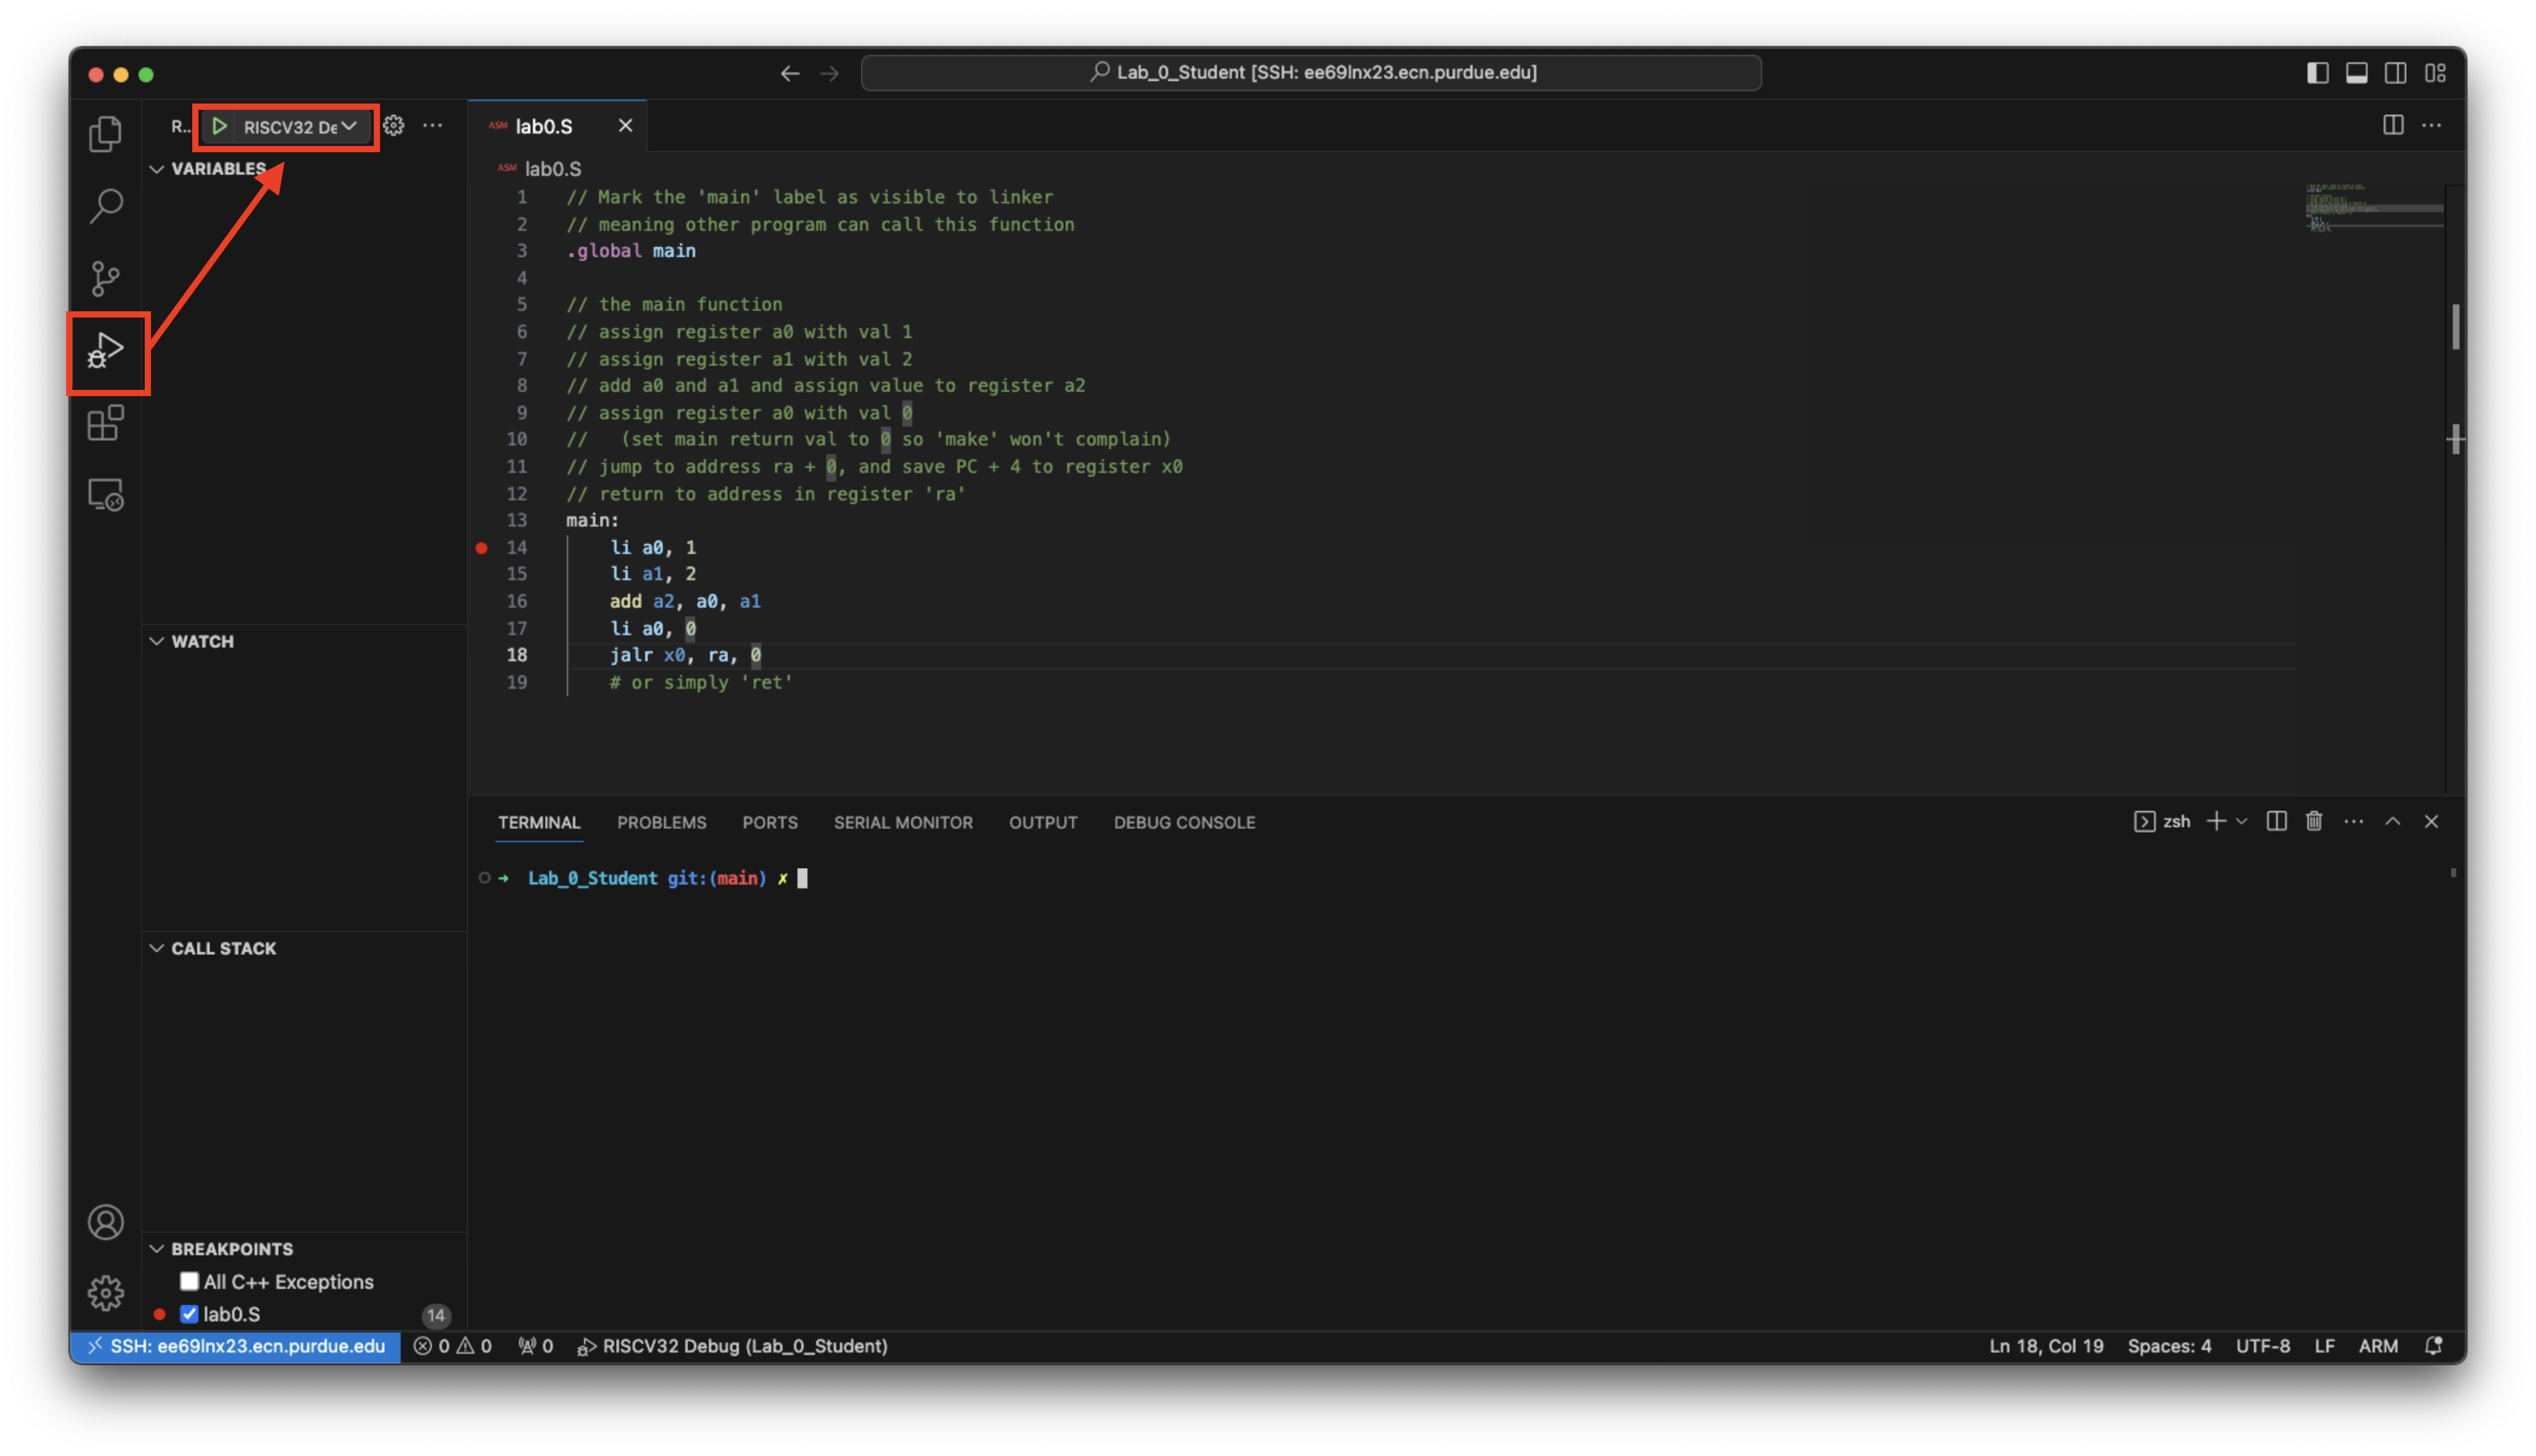
To start debugging, press the debug button on the left panel and run the RISCV32 Debug debug target:
This will build your assembly program and launch the emulator to wait for gdb connection. If you encounter errors in your program, the debug session will fail and you could see red lines under the wrong lines of code:
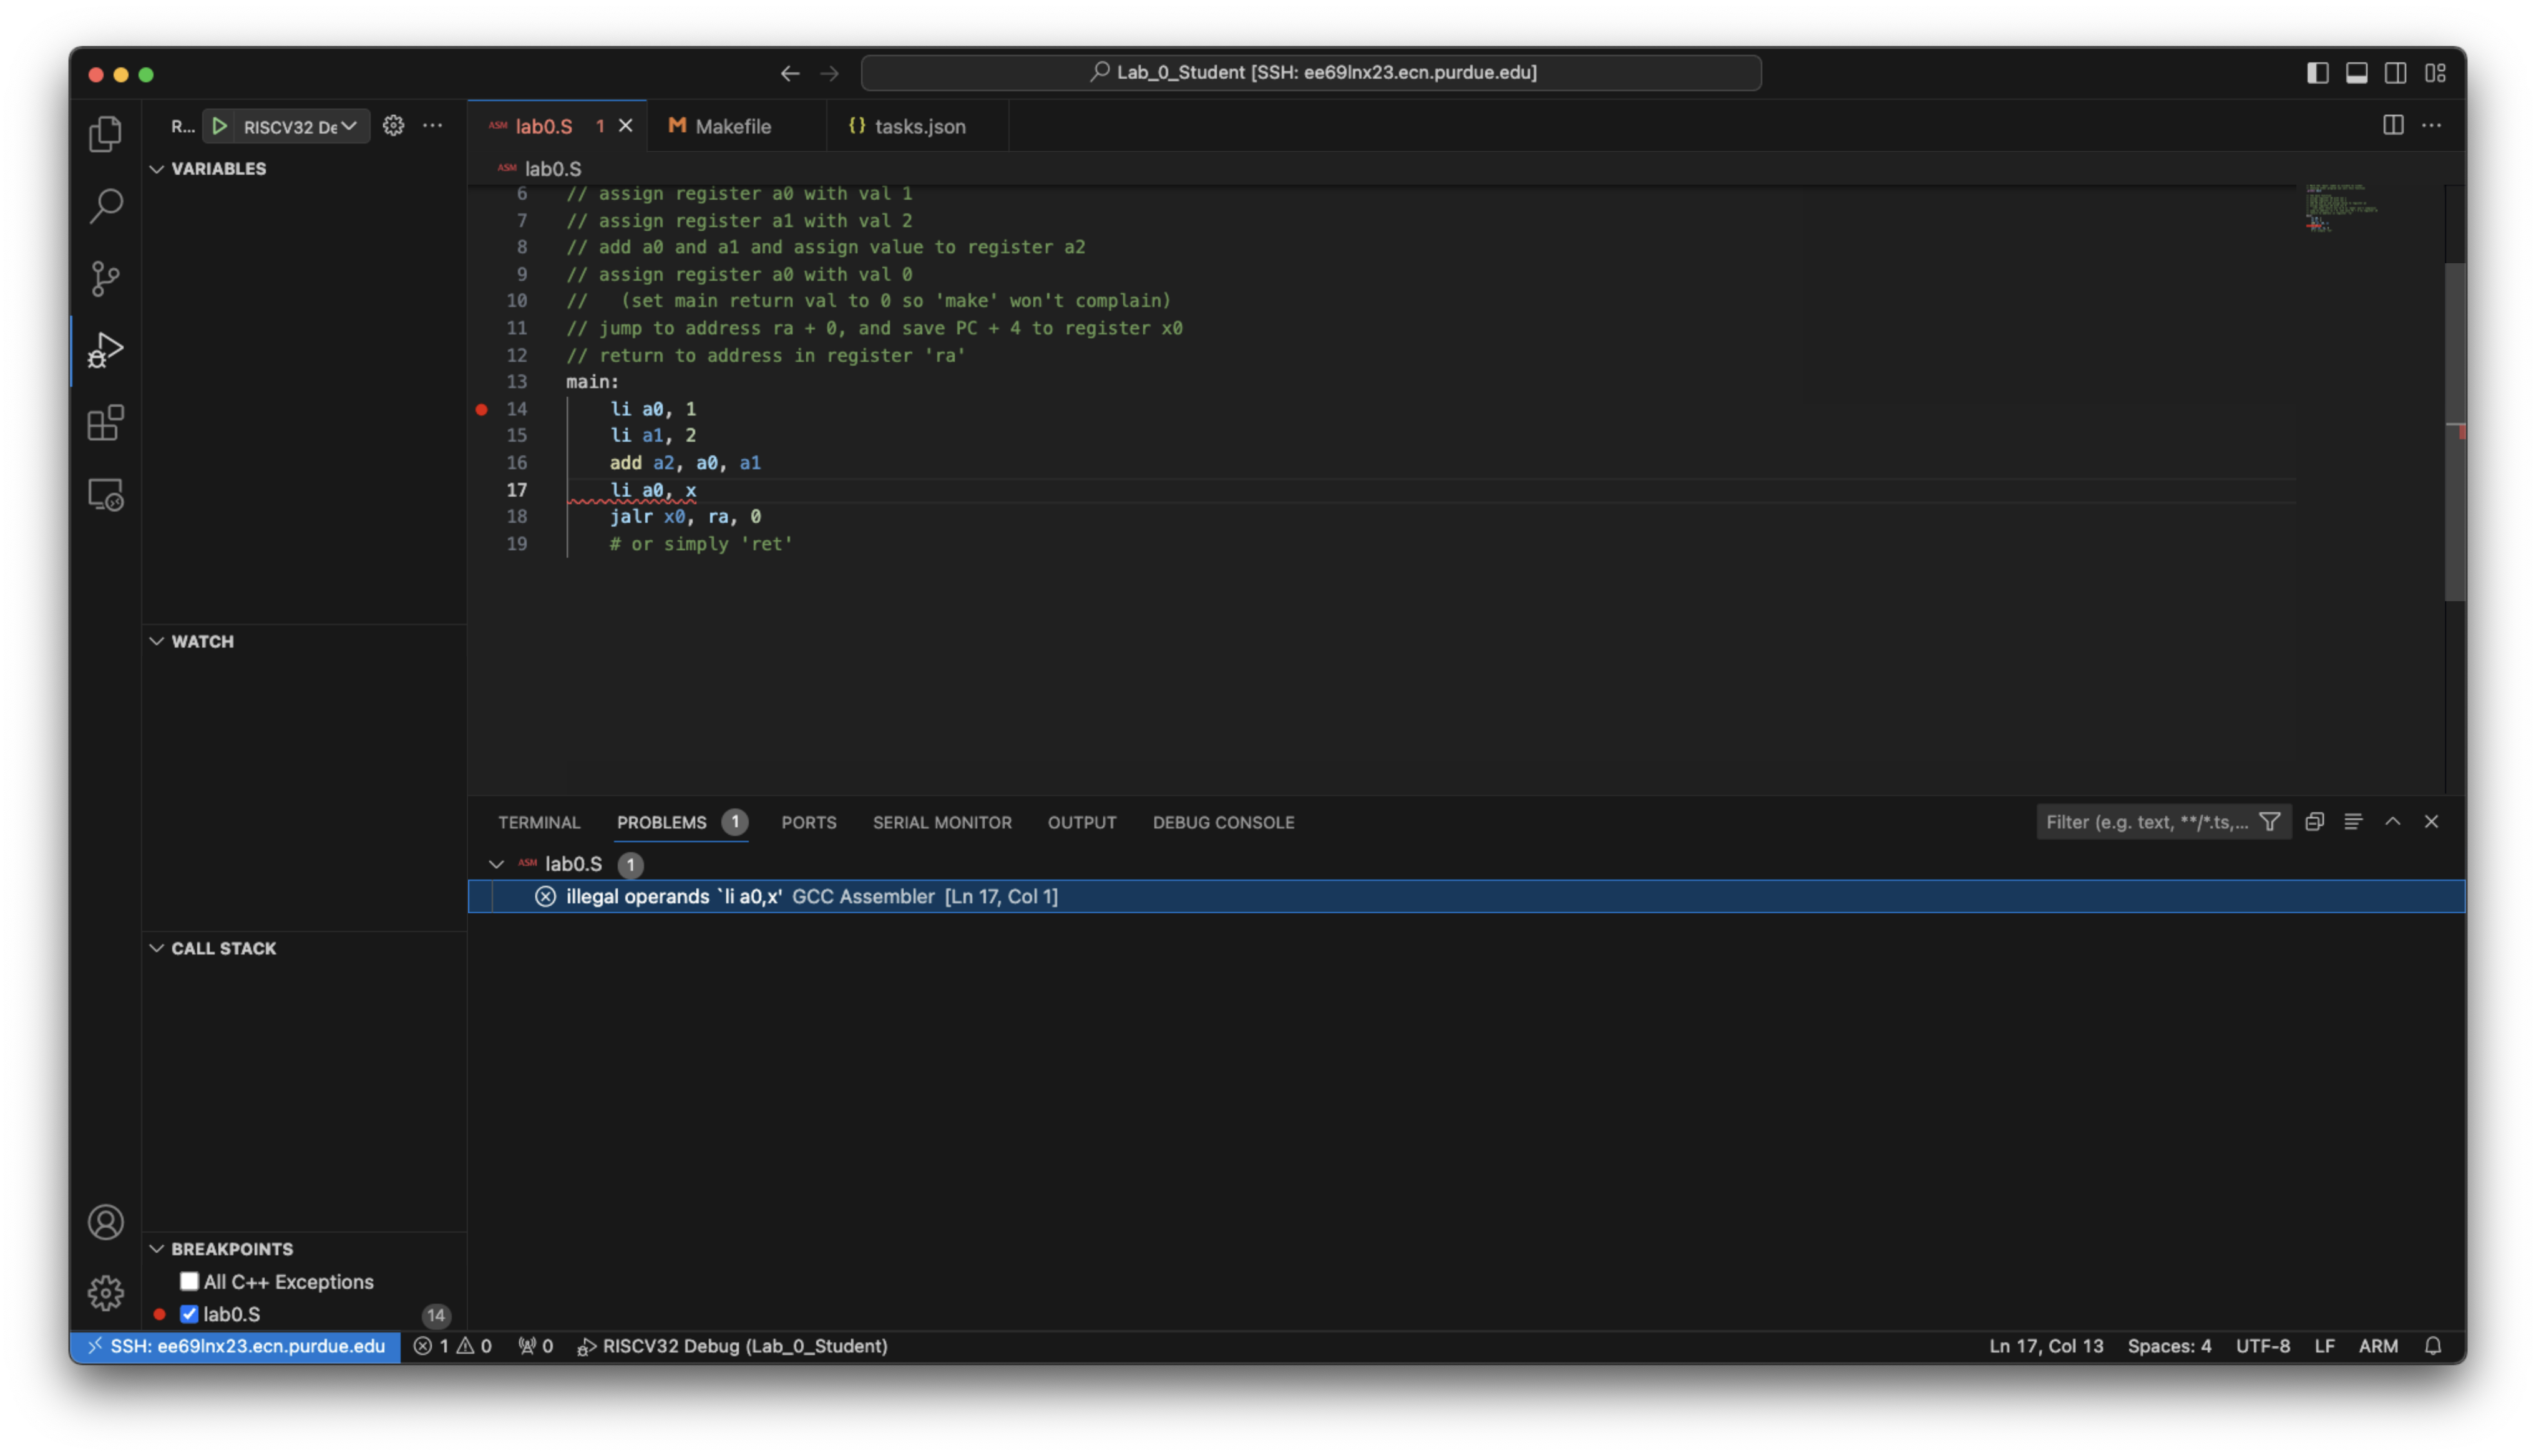
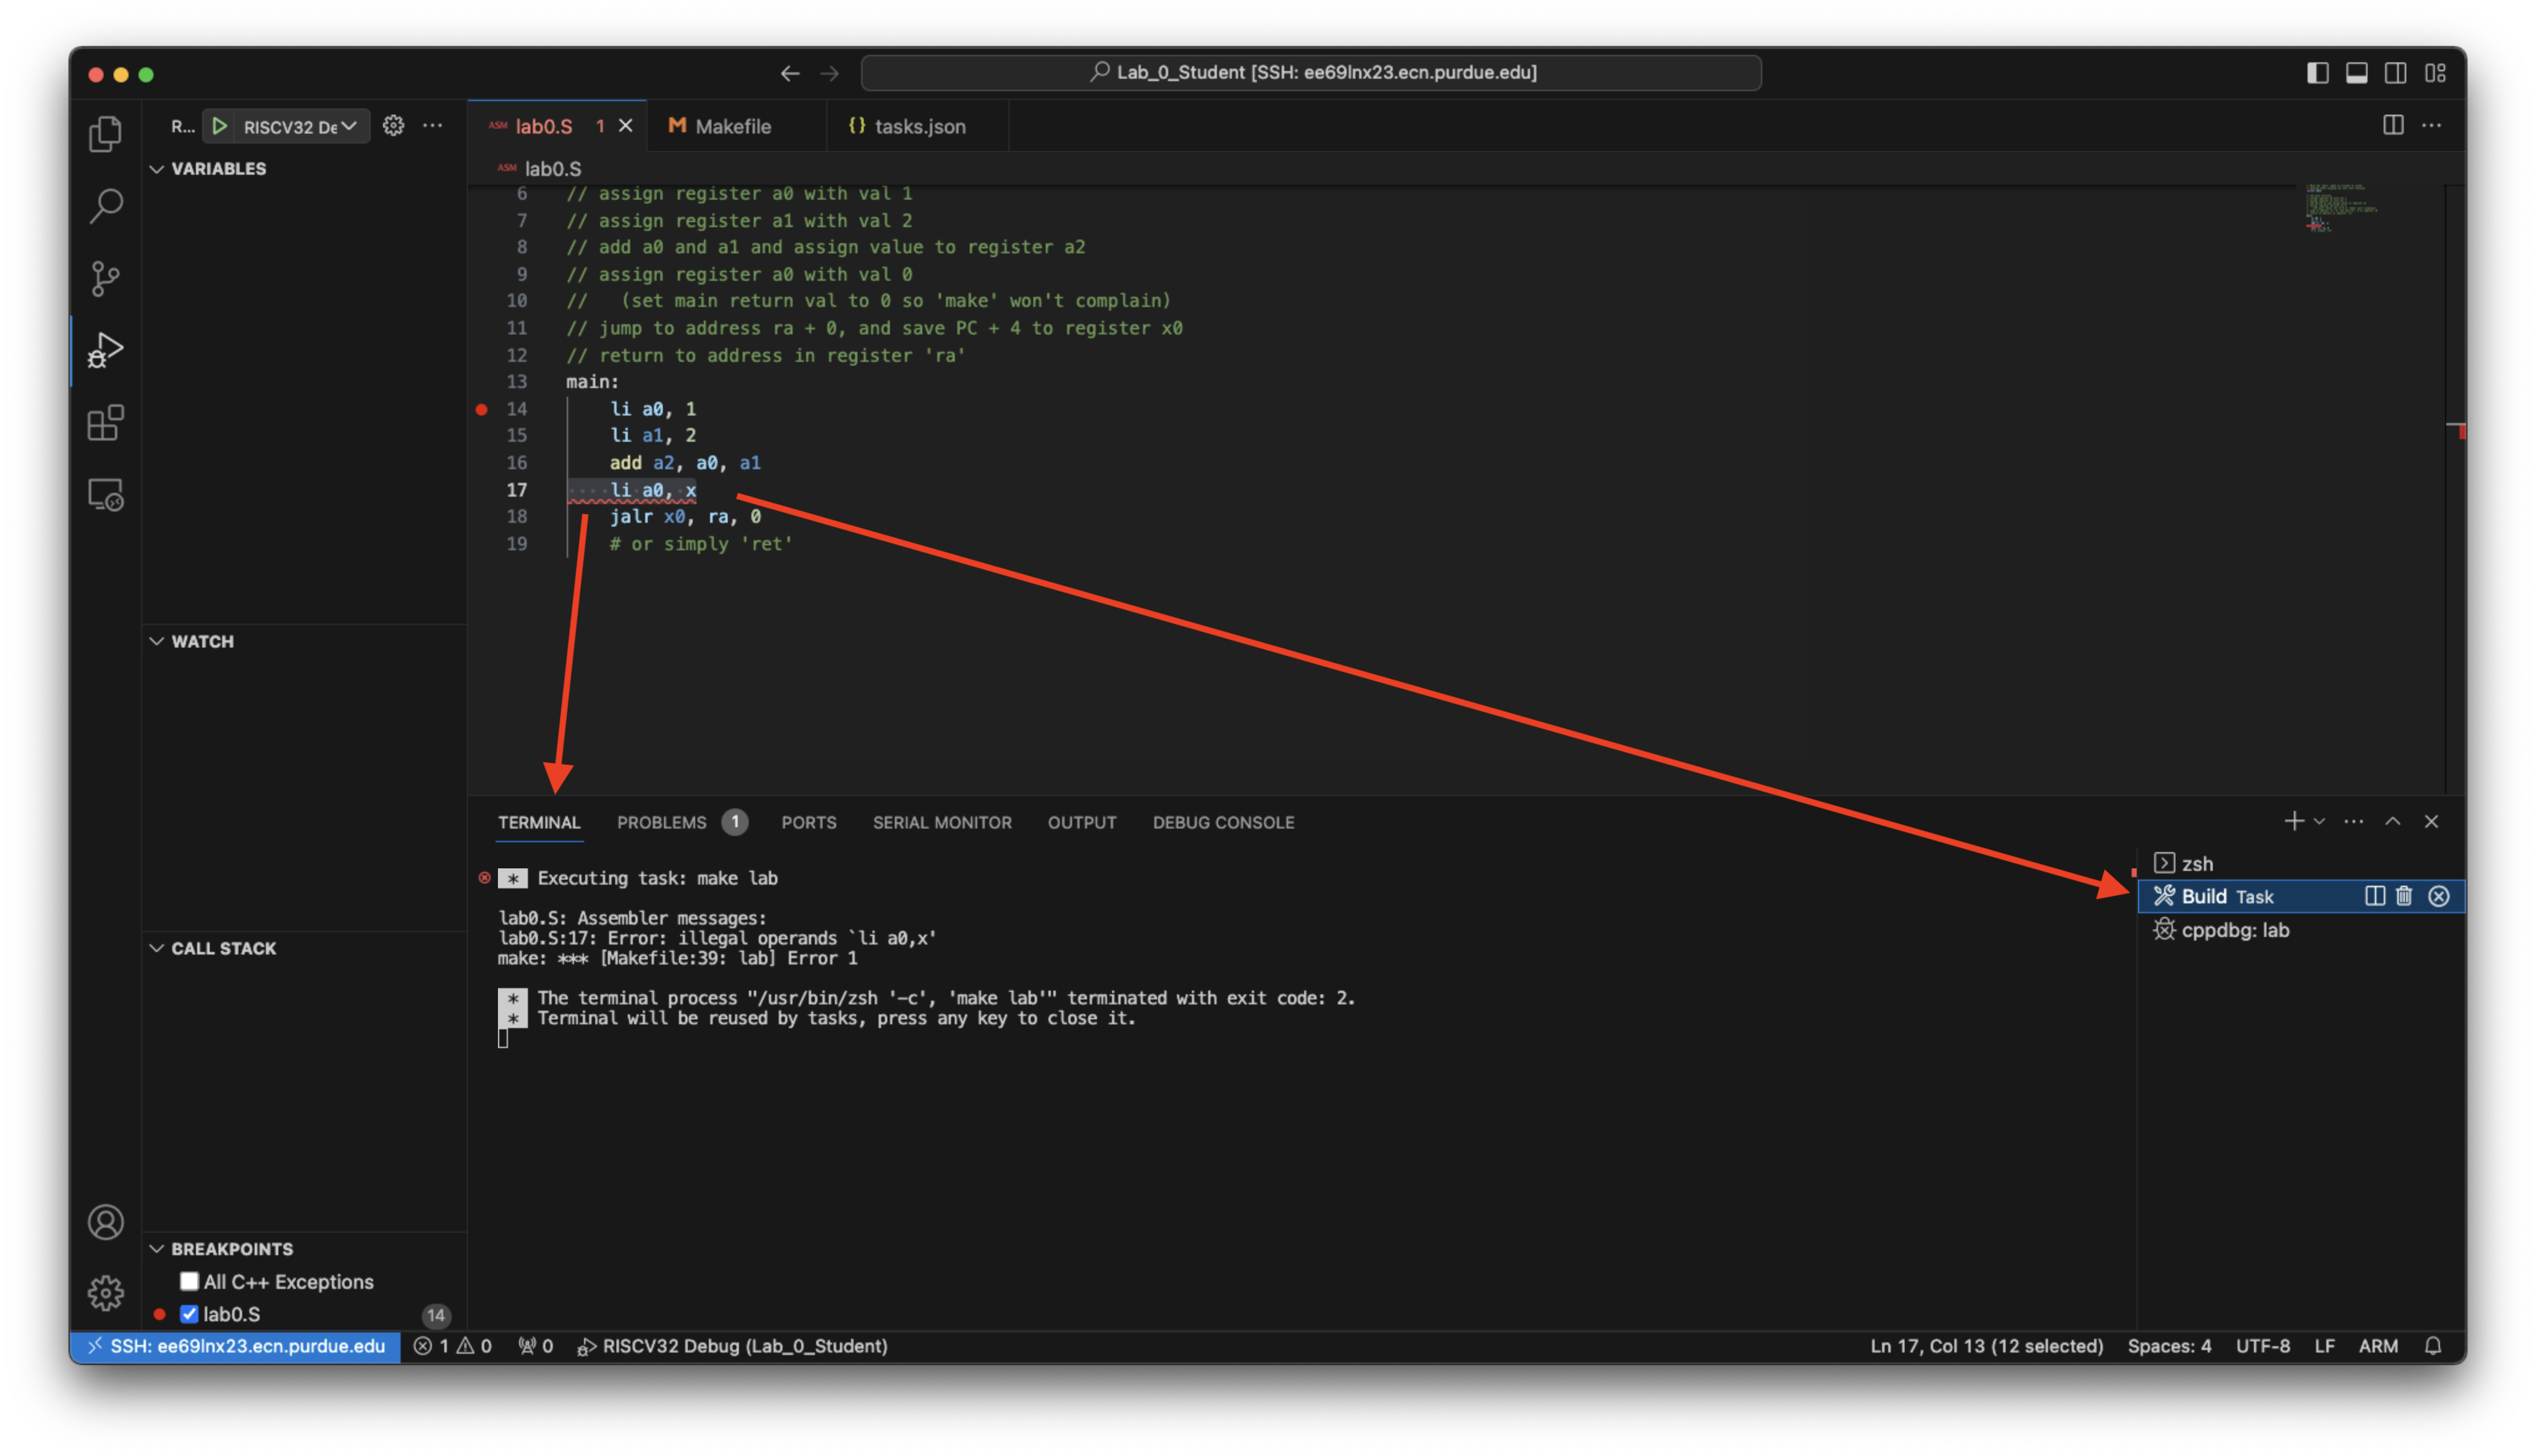
You could find the error messages by hovering on the wrong lines of code, check out the Problems tab below, or in the TERMINAL tab in terminal Build Task:
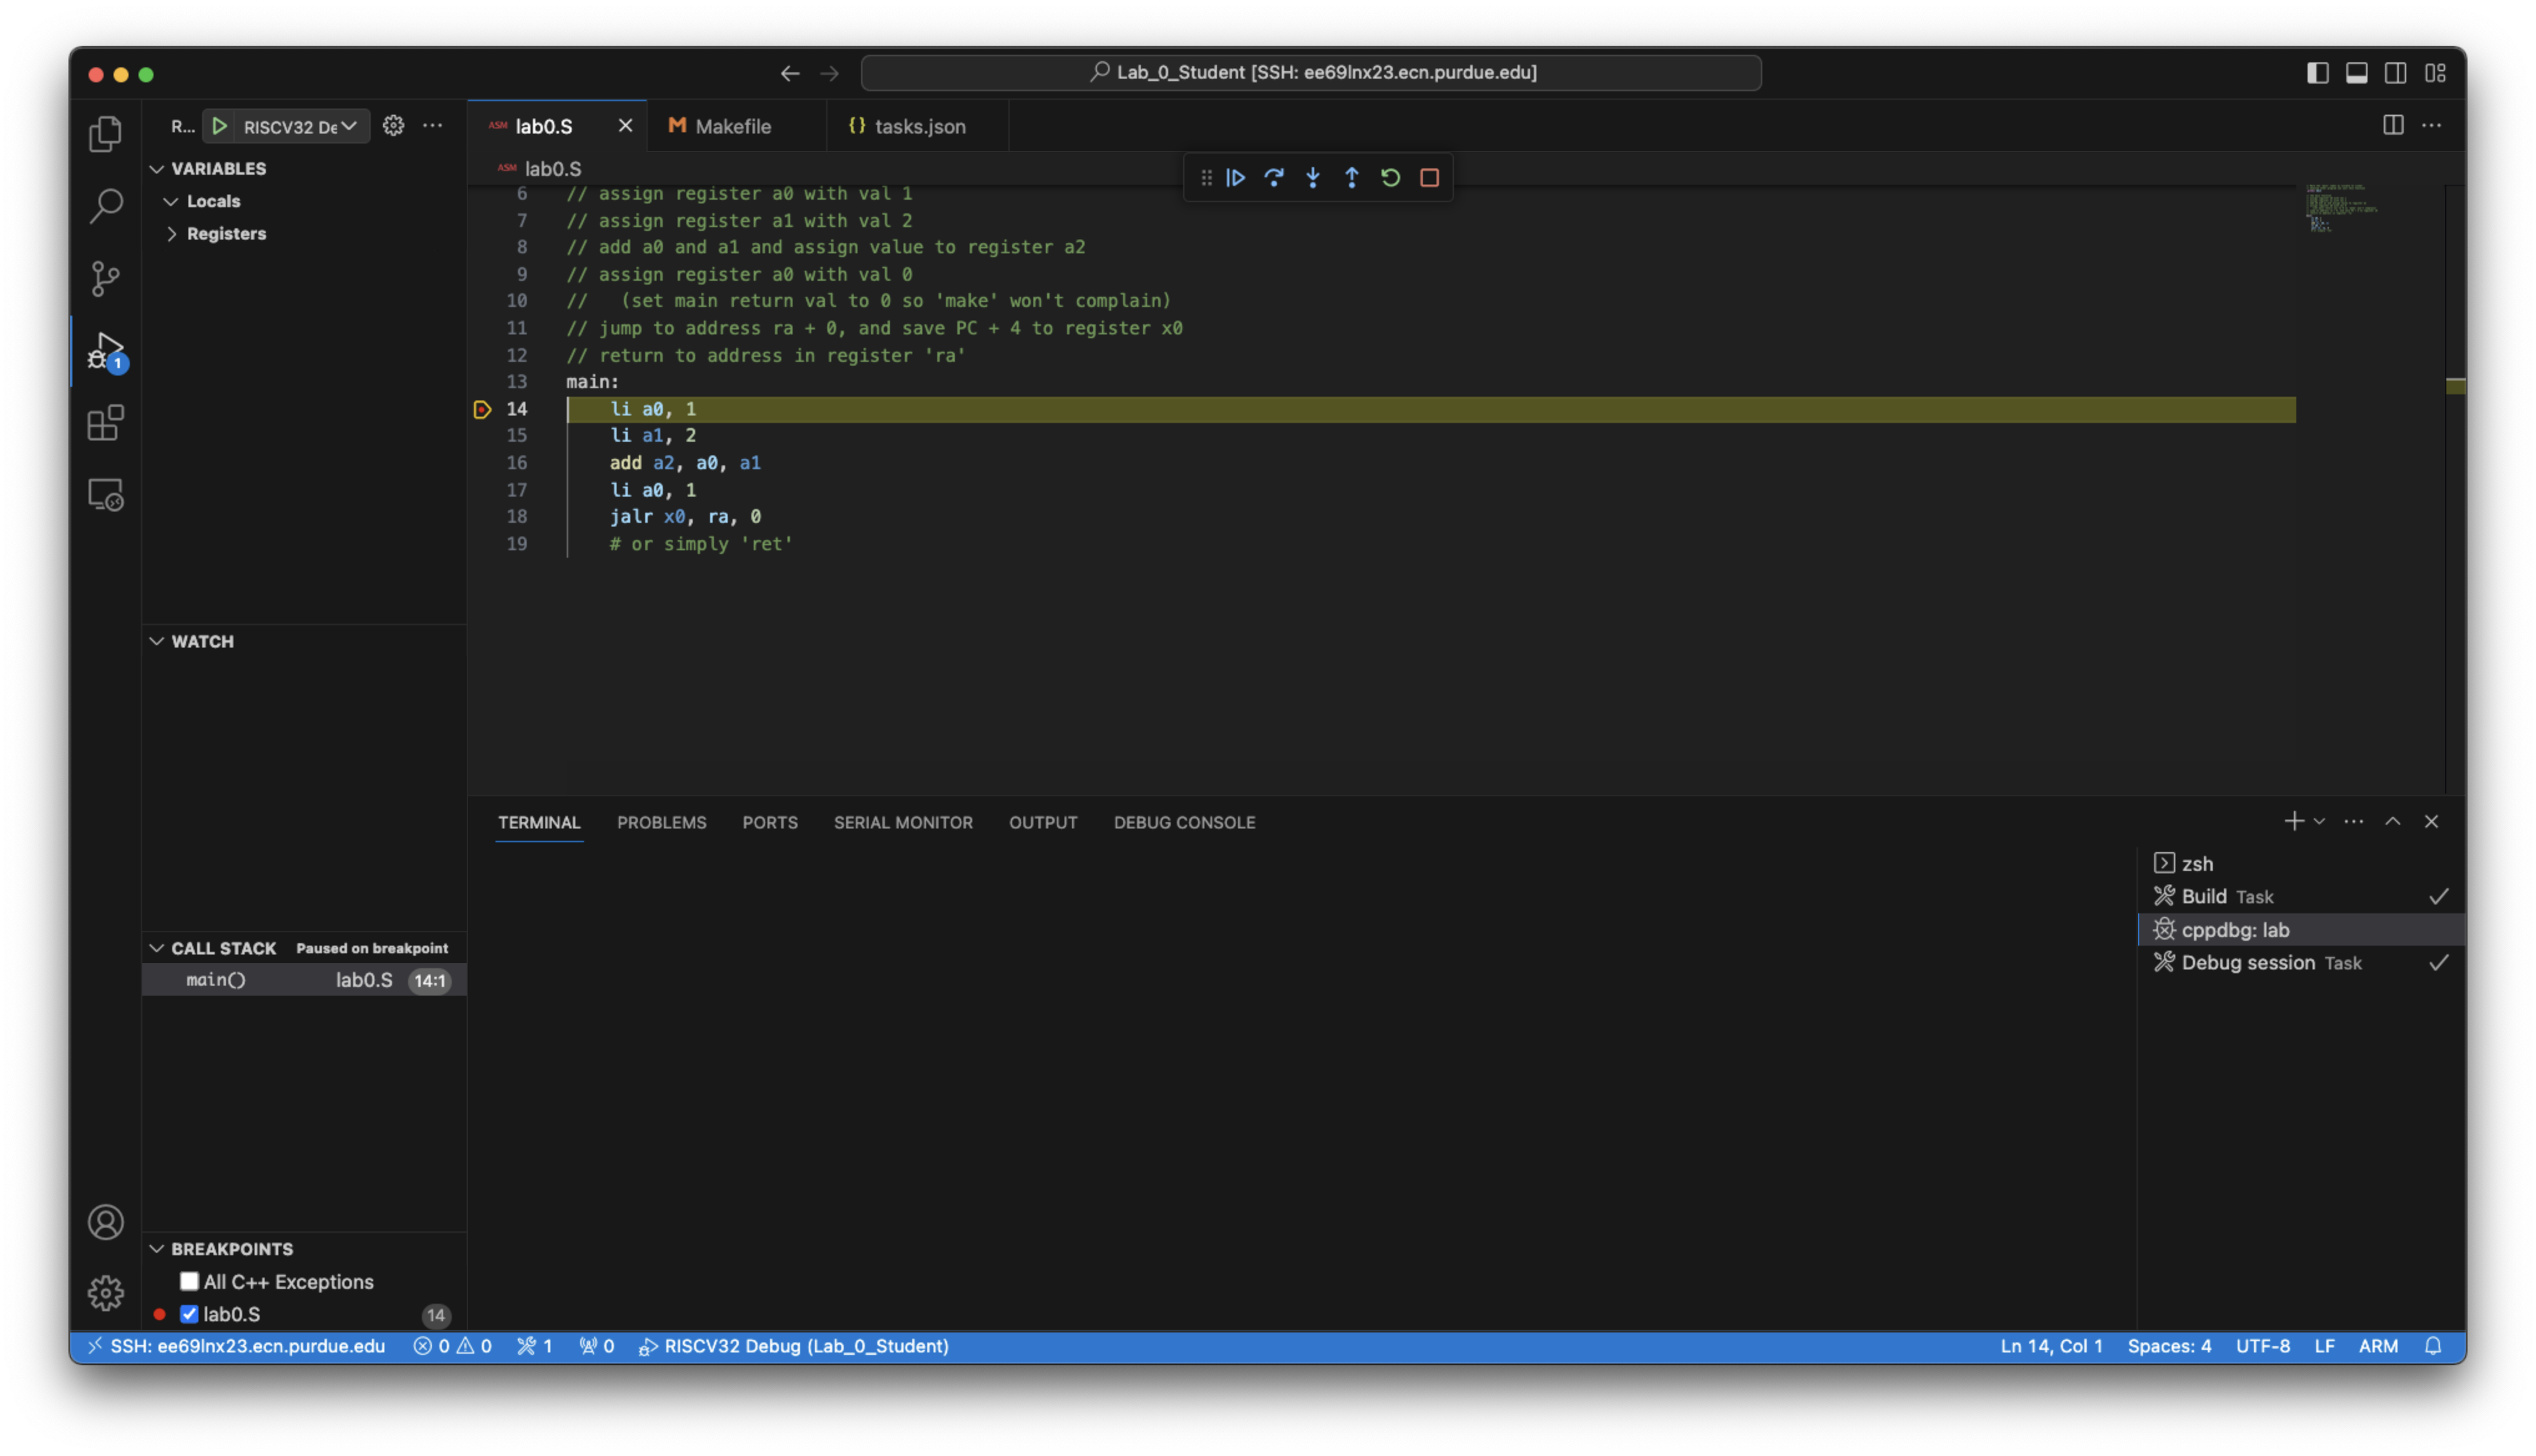
After the debugging begins, you will see VSCode pause at the first breakpoint you set:
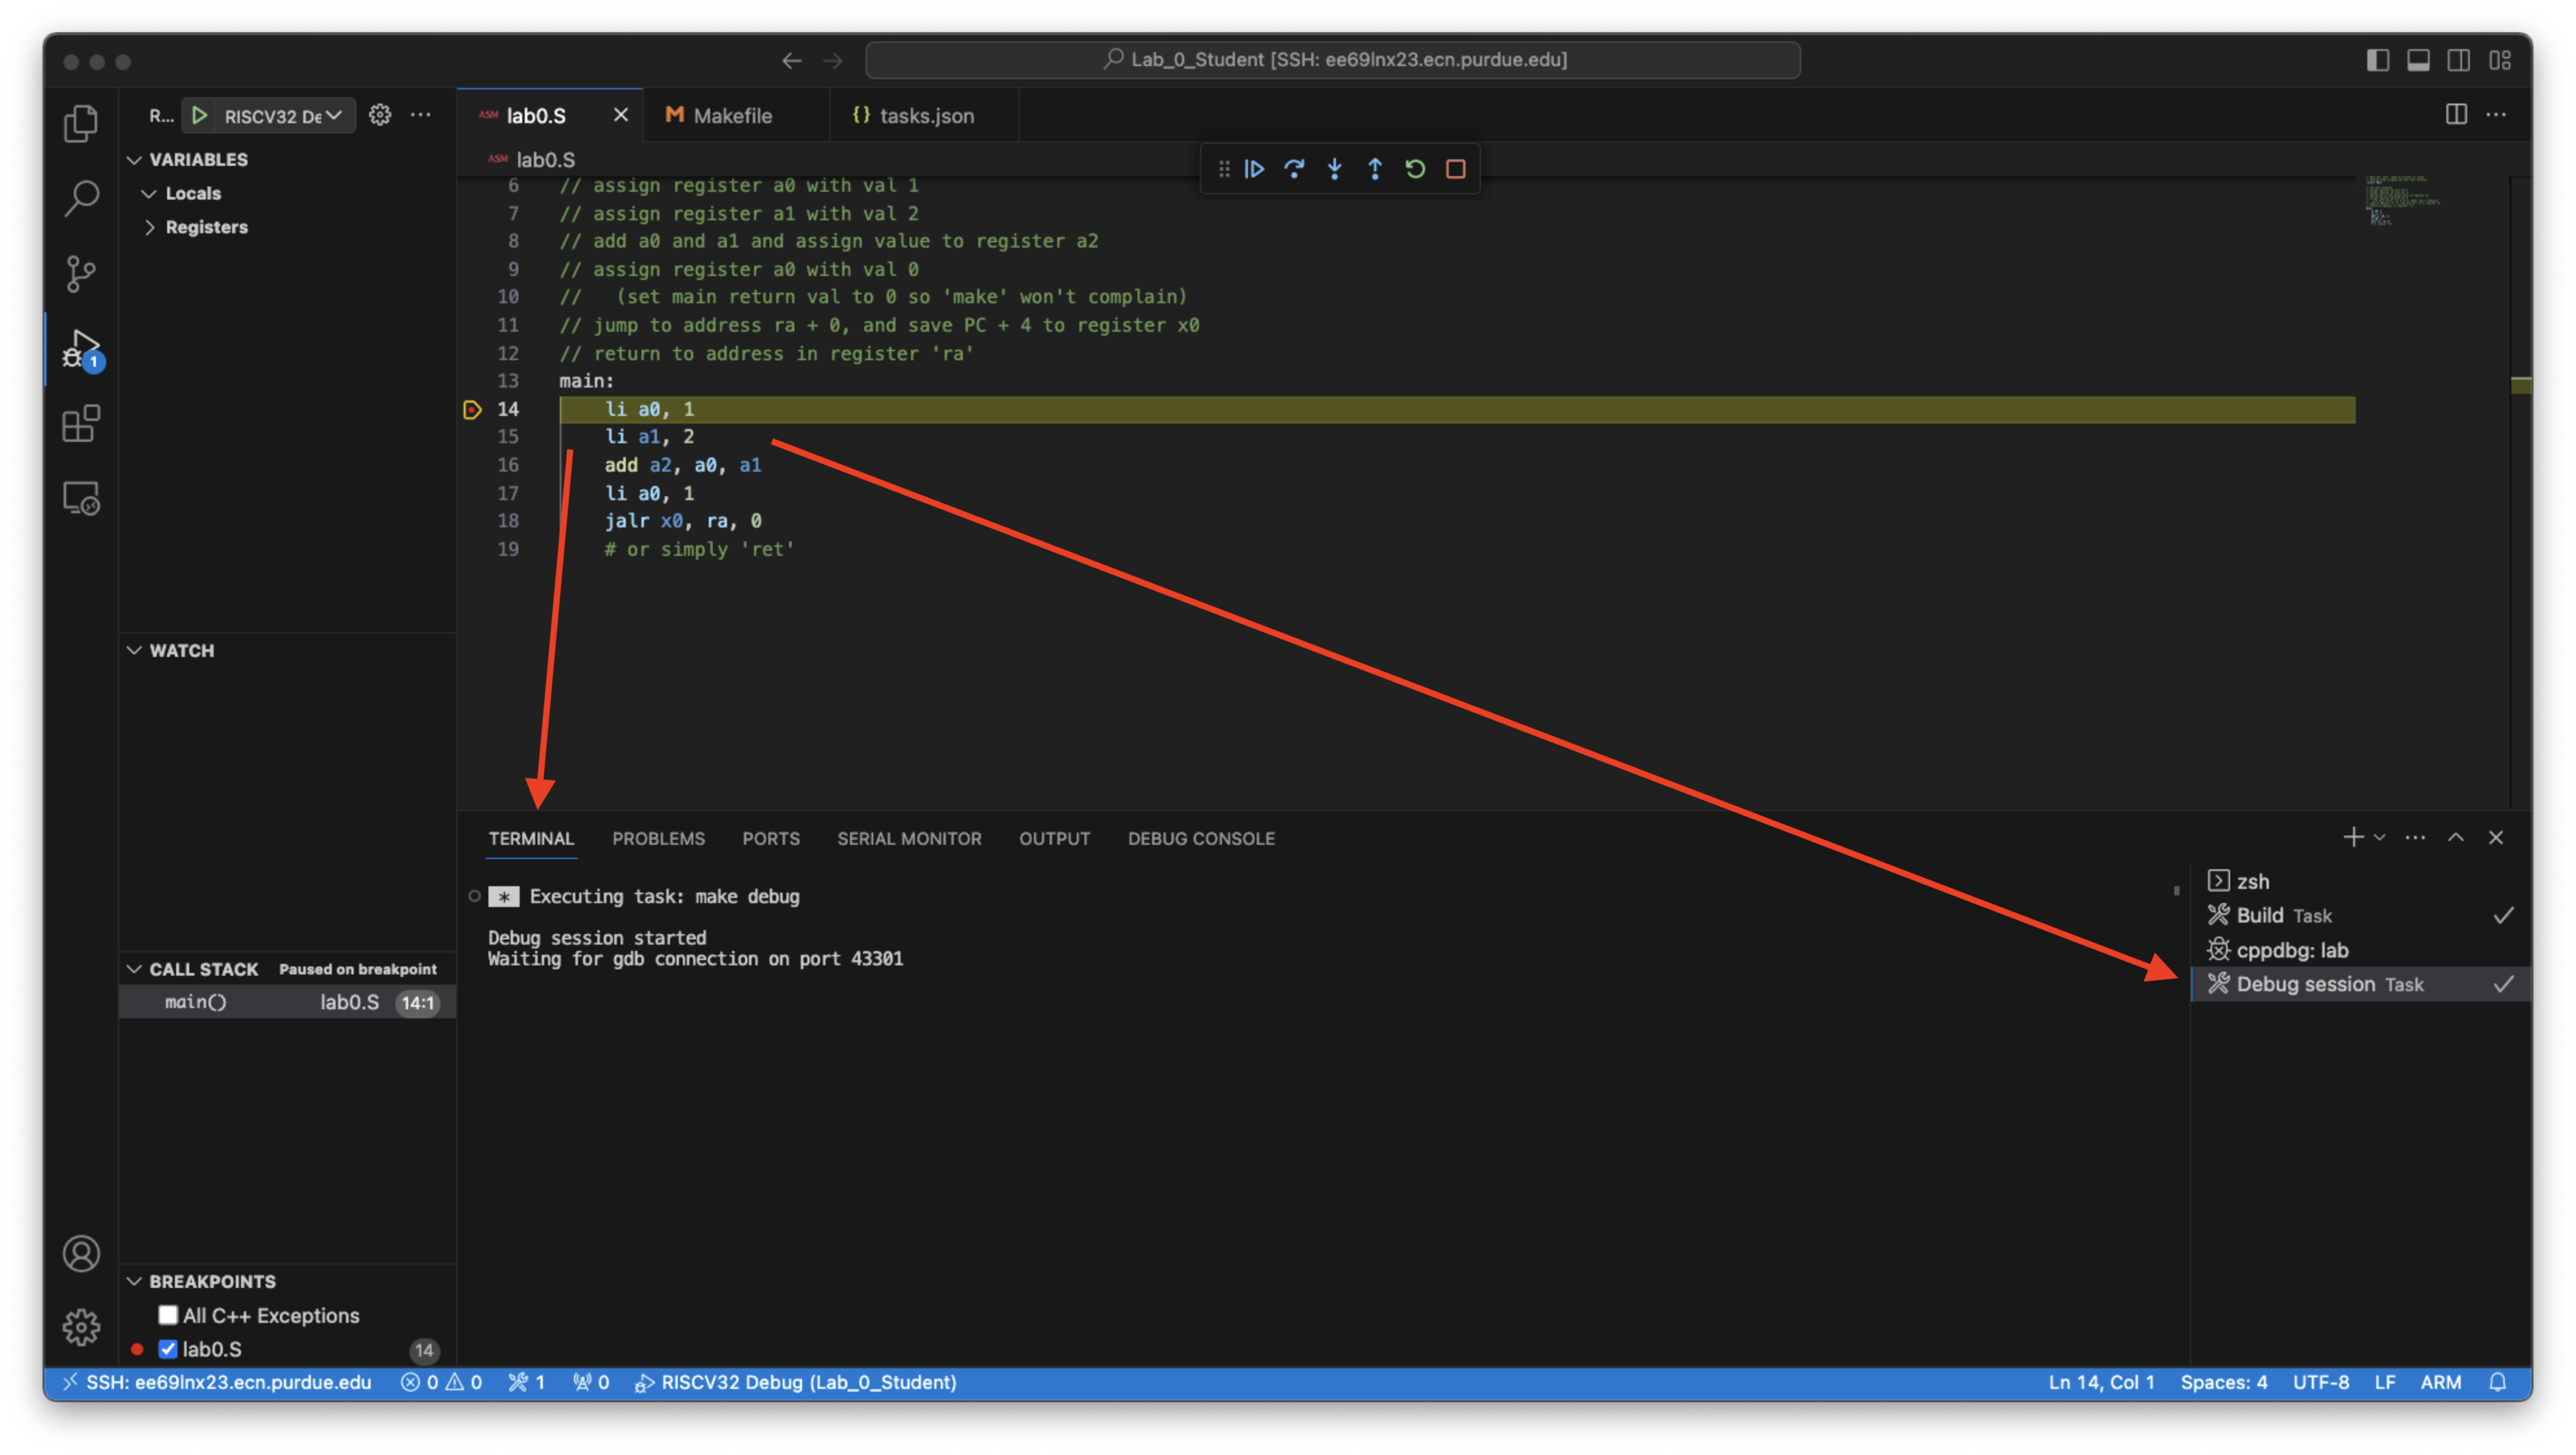
To view the program output, click on Terminal and select the Debug session tab on the right:
2.2.1 Debugger control buttons
As you launch the debugger, you could see a control panel on top like:

From left to right, for each button:
- Continue to next breakpoint
- Step over an instruction, will not enter subroutine
- Step into an instruction, if it is a function call, will enter the function
- Step out a function call
- Restart debugging
- Stop the debugging
2.2.2 View register value
You can view the registers value on the left under Registers/CPU.
2.2.3 View memory content
To get values at some memory address, you will need to use the Debug Console tab in VSCode and type the command -exec x [address]. Reference guides can be found here and GNU website.
You could also directly examine content at address in registers. Said if I want to examine the string starting at address storing in register a0, I could do:
# s: print the memory content as C string
# $a0: use the value in register a0 as the address
-exec x/s $a0
2.3 Finish debugging
After you are done with the lab, please make sure to stop your debugging session using the control buttons. **Do not close the VScode window immediately - if you quit too soon, you’ll create orphaned processes that will keep running on the server, slowing it down over time.
Note: Most of the debugging work is encapsulated in VSCode and the
Makefile. If you want to know more about this, checkout section 3, otherwise, skip to section 4.
Note: Demonstrate that you can run and debug in this environment to your TA.
3. Under the hood
Note: This section explain how the lab work under the hood and is entirely optional. You can skip directly to section 4 for lab8 if you want.
Note: If you want to setup and run lab on your own computer, this section will list out the required packages and procedures.
3.1 Running RISCV?
You might be wondering how the x86-based CPU of your lab computer is capable of running a RISC-V program, which is completely different from x86 assembly. That’s easy - we don’t! We actually use something called a system emulator called QEMU. This is a specialized program that has been compiled to run on x86 hardware, which can execute RISC-V instructions.
In addition, to support syscalls (system calls, part of the operating system that allows programs to interact with resources like a keyboard or mouse) like those underneath printf and malloc, we choose the QEMU user space emulator (qemu-riscv32-static) which will capture those syscalls and use the host OS (x86 Linux) to execute them instead, since QEMU does not emulate the entire Linux system - just instructions.
3.2 Install the toolchain on own machine
Note: Do not run this on a lab machine or eceprog! This is only if you have your own Linux machine.
If you wish to run the lab on your own Linux machine, here are the packages you will need:
- QEMU emulator
- Download QEMU user space emulator
- Ubuntu:
apt install qemu-user-static
- RISC-V GNU Compiler Toolchain
- Repo:
https://github.com/riscv-collab/riscv-gnu-toolchain - We are using the 32-bit/64-bit newlib compiler, make sure to run
configureas follows:./configure --prefix=/path/to/riscv --enable-multilib
- Execute
makedirectly - do not runmake linux.
- Repo:
After downloading, building and installing the RISC-V toolchain, you will need to add it to your PATH variable like what we did for lab machine (change command depending on your shell):
echo "export PATH=$PATH:/path/to/riscv/bin" >> ~/.bashrc
If you wish to set up on MacOS or Windows, you will need to use docker or other virtualization tool to create a Linux VM to run the qemu-riscv32-static. Microsoft also offers WSL2, which is a fully functional Linux environment that runs alongside Windows. It might be tempting to use Docker to run a full system RISC-V Linux (yes - this exists!, but then you will need to compile Linux from source targeting RISCV32 as most Linux distros only have official images for 64-bit RISC-V, which is why we’re not using Docker.
3.3 Makefile Deep Dive
This section will provide an overview on the few make commands that you used in section 2 to help debugging.
Note: Use
make helpto get short descriptions for all the make commands.
3.3.1 Debugging lab with gdb
# Debug the lab
debug: lab port kill
	@echo "target remote localhost:`sed -n '1 p' port.env`" > ./qemu_riscv32.gdbinit
	@echo "Debug session started"
	@echo "Waiting for gdb connection on port `sed -n '1 p' port.env`"
	@$(QEMU) $(QEMU_FLAGS) -g `sed -n '1 p' port.env` $(EXE)
In a terminal, make debug will start the QEMU emulator and let it wait for gdb connection on an unused port in port.env, which is generated with the recipe:
# Obtain an unused port
port:
	@ruby -e 'require "socket"; puts Addrinfo.tcp("", 0).bind {|s| s.local_address.ip_port }' > ./port.env
This one line ruby command will ask the system for an unused port via Addrinfo.tcp("", 0) and get its port number by .bind {|s| s.local_address.ip_port }. With puts and >, this will be printed out and redirected to a file, ./port.env.
Also, as we have set port to be a PHONY target, it will get called every time we invoke it, thus providing an almost guaranteed available port.
Note: By “almost”, it is possible to get a port collision during the time span after
port.envgets generated, and before QEMU is launched. This process is not atomic but it is unlikely this will happen unless you plan to do it - there are 65536 ports on Linux, and you and the other person would need to be on the same machine and issuemake portat the exact same time.
Besides the port file, the debug recipe will also create a qemu_riscv32.gdbinit file, which is “consumed” by the VSCode debugger at launch so that it will know the remote gdb port number we have given:
@echo "target remote localhost:`sed -n '1 p' port.env`" > ./qemu_riscv32.gdbinit
To debug with gdb directly, run make debug in a terminal, which invokes the QEMU emulation. Then, open another terminal and run:
riscv64-unknown-elf-gdb -x ./qemu_riscv32.gdbinit lab
Which should let you attach to the QEMU gdb session and start debugging via the command line.
3.2 Closing QEMU
You might notice that you cannot just ctrl + c in the terminal where you have make debug running. This is because the SIGINT signal indicated by ctrl + c is forwarded to the running RISC-V program inside the QEMU emulation. However, since we are using the baremetal RISC-V toolchain with no Linux support, it won’t respond to most Linux system signals sent to it.
If you wish to close QEMU, you could either start a debug session with VSCode or gdb and close it to let QEMU ends, or you could use the Makefile target make kill, which will send a kill signal to QEMU.
4. Lab 8 Quiz
After you finish, follow the lab 8 quiz document and answer the questions with debugger. Show your answers and your setup environment on your own machine, or on the lab machine, to the TAs.
Also remember to close the debug session properly with make kill.
5. Troubleshooting
5.1 make: riscv64-unknown-elf-gcc: No such file or directory
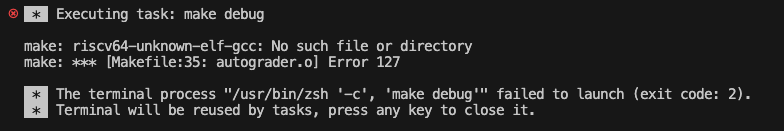
Solutions:
- Make sure you ran
module load riscvfirst. You must be on a lab machine, or eceprog, for this to work. - If this does not work, make a post on Piazza.
5.2 Configured debug type 'cppdbg' is not supported. when debugging in VSCode
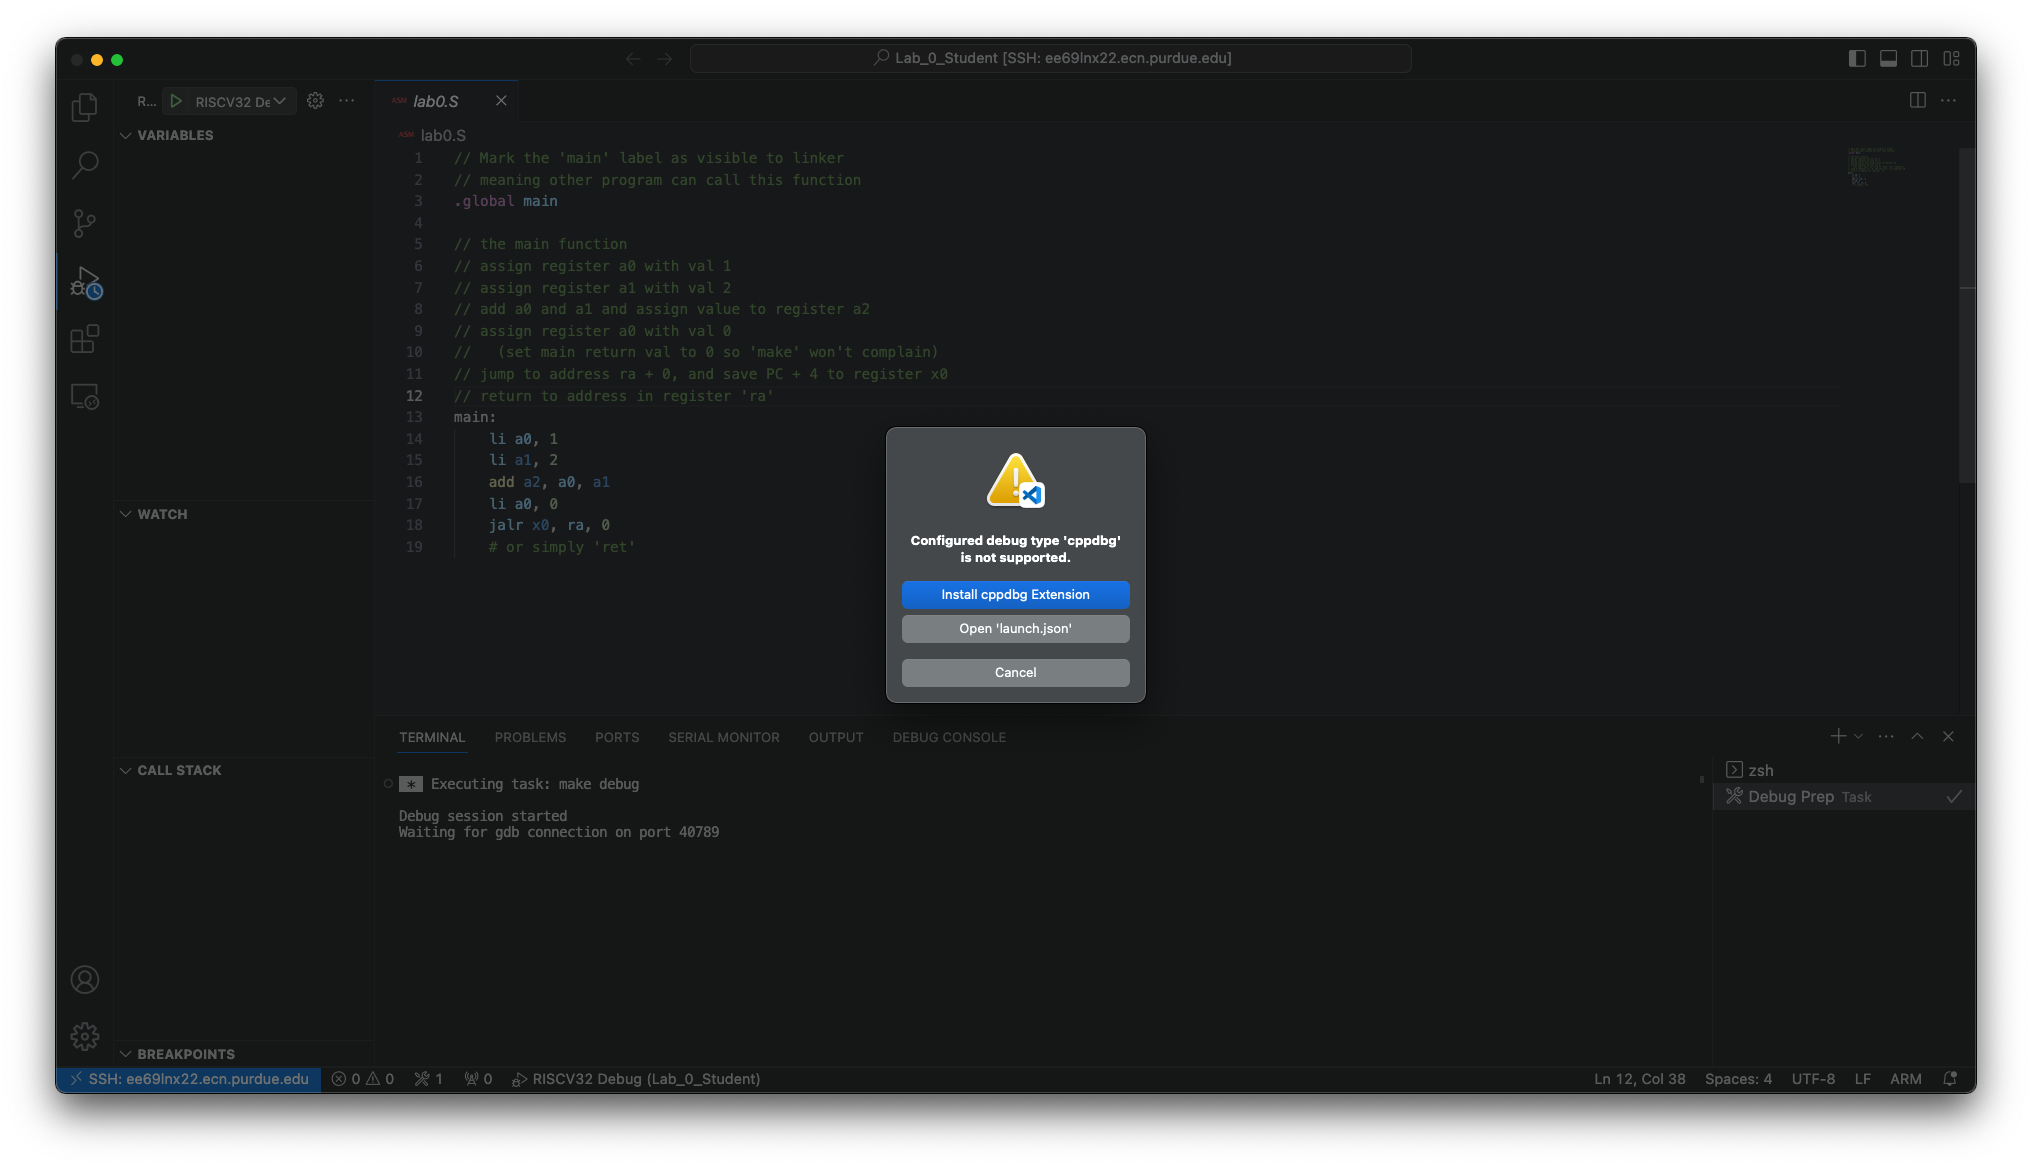
Solutions: Just click the Install cppdbg Extension button and relaunch debug session once it completes.
5.3 Check your miDebuggerPath or similar errors while debugging
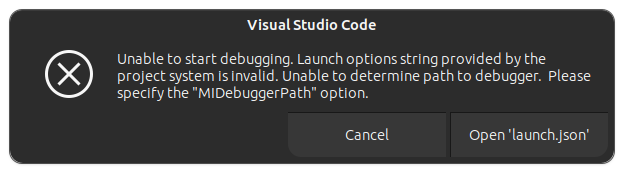
- This usually happens if students ran VScode before running
module load riscv. On the machine that you are connecting to, start a separate SSH session, and runpkill -f code-server. This will close all remaining VScode Remote instances. - Then, double-check that your
~/.bashrcand~/.profilefiles to ensure that you copy-pasted thecasestatement from step 1.1 of this lab in order to load the RISC-V tools correctly. Double-check that you can find the compiler after logging in. - Then, try reconnecting to the same server with VScode Remote.
- If this still does not work, you can also try hardcoding the path to the debugger. This isn’t usually recommended, but since it’s limited to this project folder, it should be fine for the time being. Remember to do this for each lab folder you work on.
- In a terminal, run
which riscv64-unknown-elf-gdb. This returns the location of the gdb executable. - Copy this path, and open
.vscode/launch.jsonin your lab folder. - Change the value of the key “miDebuggerPath” to the path you just copied.
- In a terminal, run